

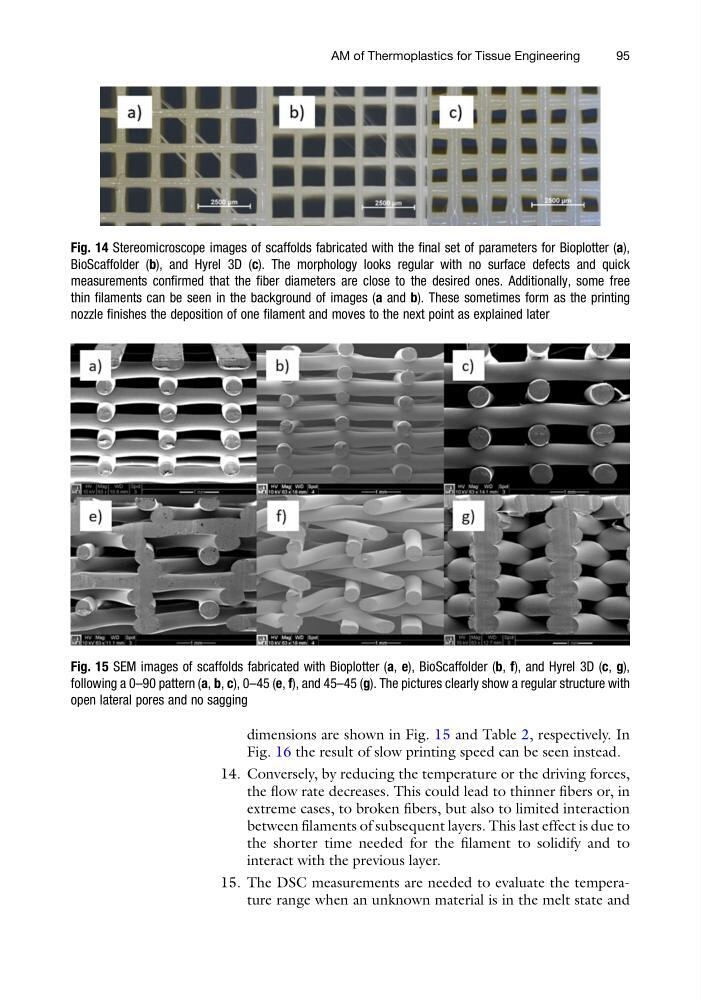
dimensions are shown in Fig. 15 and Table 2, respectively. In
Fig. 16 the result of slow printing speed can be seen instead.
14. Conversely, by reducing the temperature or the driving forces,
the flow rate decreases. This could lead to thinner fibers or, in
extreme cases, to broken fibers, but also to limited interaction
between filaments of subsequent layers. This last effect is due to
the shorter time needed for the filament to solidify and to
interact with the previous layer.
15. The DSC measurements are needed to evaluate the temperature range when an unknown material is in the melt state and
Fig. 14 Stereomicroscope images of scaffolds fabricated with the final set of parameters for Bioplotter (a),
BioScaffolder (b), and Hyrel 3D (c). The morphology looks regular with no surface defects and quick
measurements confirmed that the fiber diameters are close to the desired ones. Additionally, some free
thin filaments can be seen in the background of images (a and b). These sometimes form as the printing
nozzle finishes the deposition of one filament and moves to the next point as explained later
Fig. 15 SEM images of scaffolds fabricated with Bioplotter (a, e), BioScaffolder (b, f), and Hyrel 3D (c, g),
following a 0–90 pattern (a, b, c), 0–45 (e, f), and 45–45 (g). The pictures clearly show a regular structure with
open lateral pores and no sagging
AM of Thermoplastics for Tissue Engineering
95
Fig. 16 the result of slow printing speed can be seen instead.
14. Conversely, by reducing the temperature or the driving forces,
the flow rate decreases. This could lead to thinner fibers or, in
extreme cases, to broken fibers, but also to limited interaction
between filaments of subsequent layers. This last effect is due to
the shorter time needed for the filament to solidify and to
interact with the previous layer.
15. The DSC measurements are needed to evaluate the temperature range when an unknown material is in the melt state and
Fig. 14 Stereomicroscope images of scaffolds fabricated with the final set of parameters for Bioplotter (a),
BioScaffolder (b), and Hyrel 3D (c). The morphology looks regular with no surface defects and quick
measurements confirmed that the fiber diameters are close to the desired ones. Additionally, some free
thin filaments can be seen in the background of images (a and b). These sometimes form as the printing
nozzle finishes the deposition of one filament and moves to the next point as explained later
Fig. 15 SEM images of scaffolds fabricated with Bioplotter (a, e), BioScaffolder (b, f), and Hyrel 3D (c, g),
following a 0–90 pattern (a, b, c), 0–45 (e, f), and 45–45 (g). The pictures clearly show a regular structure with
open lateral pores and no sagging
AM of Thermoplastics for Tissue Engineering
95