

Filtration Membranes Containing Nanoparticles of Hydrated …
763
where x is the membrane thickness, C i is the concentration of species, D i is the
diffusion coefficient. The interval of steady state is correlated with D i . It can be
determined by the second Fick’s law (2), which would be expressed as a function of
time.
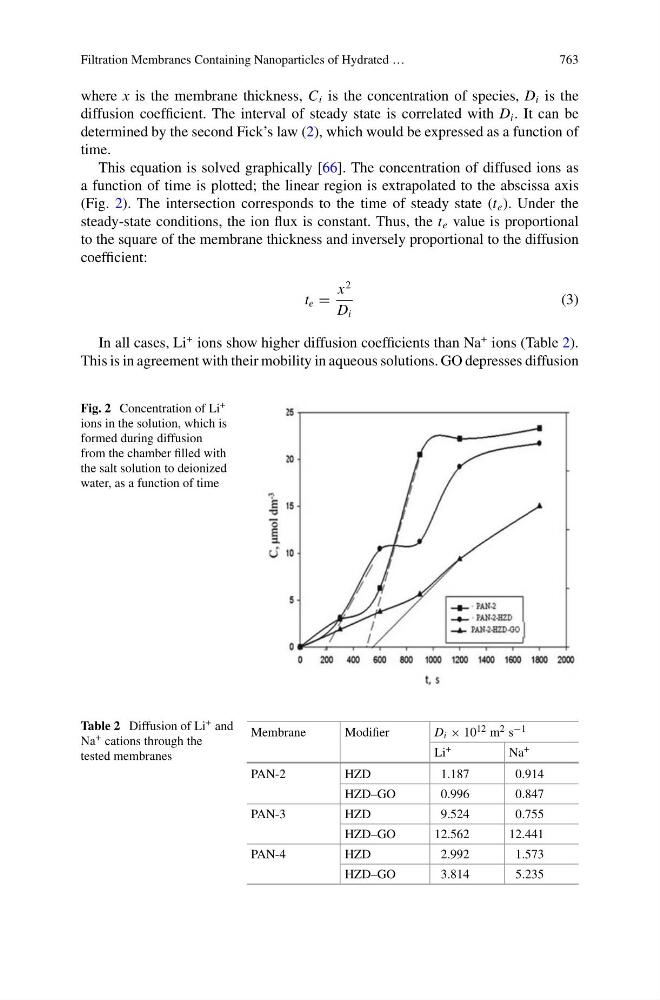
This equation is solved graphically [66]. The concentration of diffused ions as
a function of time is plotted; the linear region is extrapolated to the abscissa axis
(Fig. 2). The intersection corresponds to the time of steady state (t e ). Under the
steady-state conditions, the ion flux is constant. Thus, the t e value is proportional
to the square of the membrane thickness and inversely proportional to the diffusion
coefficient:
t e =
x
2
D i
(3)
In all cases, Li
+ ions show higher diffusion coefficients than Na
+ ions (Table 2).
This is in agreement with their mobility in aqueous solutions. GO depresses diffusion
Fig. 2 Concentration of Li +
ions in the solution, which is
formed during diffusion
from the chamber filled with
the salt solution to deionized
water, as a function of time
Table 2 Diffusion of Li + and
Na + cations through the
tested membranes
Membrane
Modifier
D i × 10 12 m 2 s −1
Li +
Na +
PAN-2
HZD
1.187
0.914
HZD–GO
0.996
0.847
PAN-3
HZD
9.524
0.755
HZD–GO
12.562
12.441
PAN-4
HZD
2.992
1.573
HZD–GO
3.814
5.235