

596
A. V. Luzanov
G
TB
p, p = 2
n
,
(14)
showing an evident exponential growth with n. This expression is valid (within TB)
if all resonance integrals are set equal, and as such (14) is simply derived from
(12). The first step in our study was to use a more adequate TB model including
the alternation of resonance integrals. We took from [18] the appropriate alternation
scheme: β c=c = 13/12β 0 β c−c = 11/12β 0 with β 0 = −2.4 eV. Yet, it provided
the better TB results which are different, but only quantitatively, not qualitatively:
instead of (14), merely a more slow exponential growth,
G
TB
p, p = 0.923 × 1.432
n
,
was numerically obtained.
These results have induced us to invoke more refined models that include explicitly
electron interaction effects. To this end we have employed RHF and EQC schemes.
As in the above studies, for controlling accuracy of the used approximations the
standard FCI model was restrictively applied (only for n = 1 and n = 2). Thus, we
could see that EQC and RHF, but not TB, offer a reasonable estimation of G
FCI
p, p in
small [n]quinodimethanes:
n = 1 : 0.492, 0.563, 0.574, 1.322,
n = 2 : 0.347, 0.453, 0, 430, 1.892.
where the first number of each set is G
FCI
p, p , and the rest are related to EQC, RHF
and TB, respectively.
The results of computing GF in the long quinoids are presented in Fig. 7. We
see that in fact the poly(phenoquinodimethanes) exhibit the same behavior as the
poly(perianthracenes) in Fig. 5. The main conclusion from Fig. 7 is also evident—
there is no increasing trend in the electric conductance at the EQC levels (and actually
at the RHF level too).
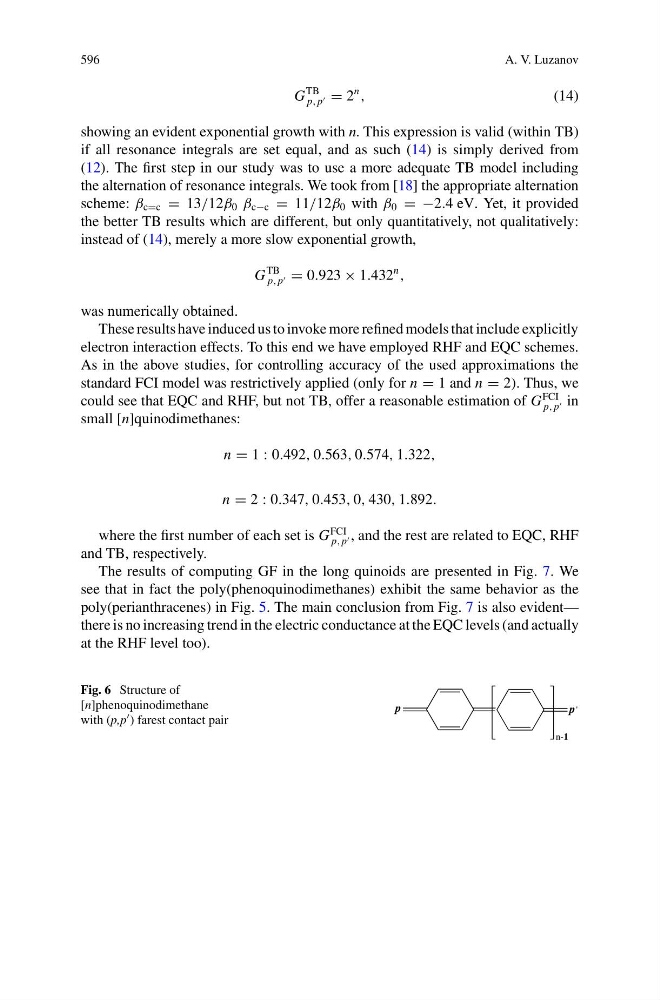
Fig. 6 Structure of
[n]phenoquinodimethane
with (p,p ) farest contact pair
n-1
p
p'