

Heating and Coagulation of Nanoparticles in a Plasma Jet
31
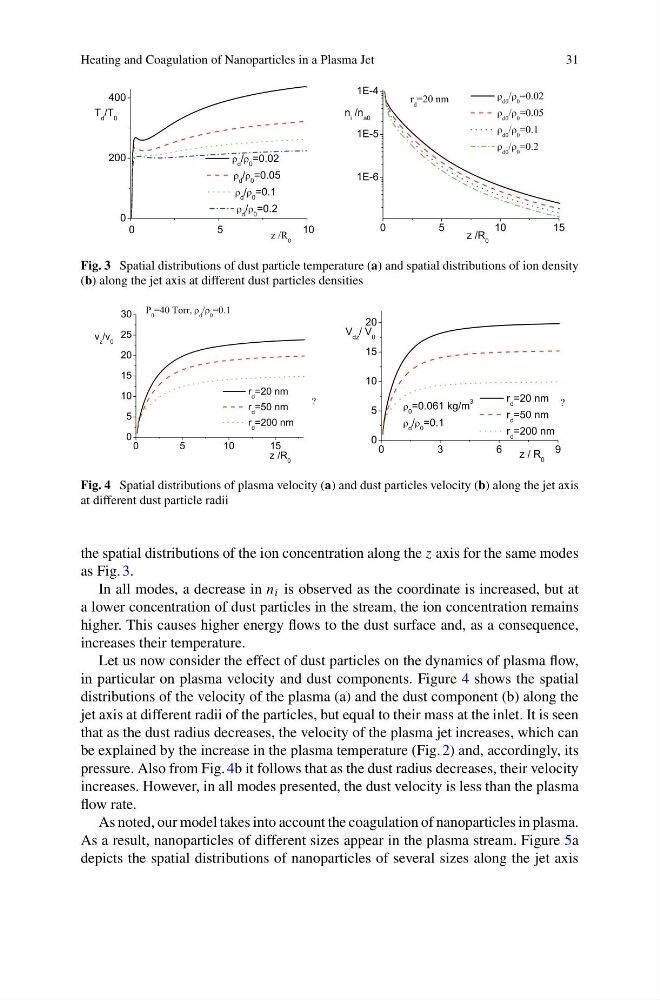
Fig. 3 Spatial distributions of dust particle temperature (a) and spatial distributions of ion density
(b) along the jet axis at different dust particles densities
Fig. 4 Spatial distributions of plasma velocity (a) and dust particles velocity (b) along the jet axis
at different dust particle radii
the spatial distributions of the ion concentration along the z axis for the same modes
as Fig. 3.
In all modes, a decrease in n i is observed as the coordinate is increased, but at
a lower concentration of dust particles in the stream, the ion concentration remains
higher. This causes higher energy flows to the dust surface and, as a consequence,
increases their temperature.
Let us now consider the effect of dust particles on the dynamics of plasma flow,
in particular on plasma velocity and dust components. Figure 4 shows the spatial
distributions of the velocity of the plasma (a) and the dust component (b) along the
jet axis at different radii of the particles, but equal to their mass at the inlet. It is seen
that as the dust radius decreases, the velocity of the plasma jet increases, which can
be explained by the increase in the plasma temperature (Fig. 2) and, accordingly, its
pressure. Also from Fig. 4b it follows that as the dust radius decreases, their velocity
increases. However, in all modes presented, the dust velocity is less than the plasma
flow rate.
As noted, our model takes into account the coagulation of nanoparticles in plasma.
As a result, nanoparticles of different sizes appear in the plasma stream. Figure 5a
depicts the spatial distributions of nanoparticles of several sizes along the jet axis
31
Fig. 3 Spatial distributions of dust particle temperature (a) and spatial distributions of ion density
(b) along the jet axis at different dust particles densities
Fig. 4 Spatial distributions of plasma velocity (a) and dust particles velocity (b) along the jet axis
at different dust particle radii
the spatial distributions of the ion concentration along the z axis for the same modes
as Fig. 3.
In all modes, a decrease in n i is observed as the coordinate is increased, but at
a lower concentration of dust particles in the stream, the ion concentration remains
higher. This causes higher energy flows to the dust surface and, as a consequence,
increases their temperature.
Let us now consider the effect of dust particles on the dynamics of plasma flow,
in particular on plasma velocity and dust components. Figure 4 shows the spatial
distributions of the velocity of the plasma (a) and the dust component (b) along the
jet axis at different radii of the particles, but equal to their mass at the inlet. It is seen
that as the dust radius decreases, the velocity of the plasma jet increases, which can
be explained by the increase in the plasma temperature (Fig. 2) and, accordingly, its
pressure. Also from Fig. 4b it follows that as the dust radius decreases, their velocity
increases. However, in all modes presented, the dust velocity is less than the plasma
flow rate.
As noted, our model takes into account the coagulation of nanoparticles in plasma.
As a result, nanoparticles of different sizes appear in the plasma stream. Figure 5a
depicts the spatial distributions of nanoparticles of several sizes along the jet axis