

498
L. V. Karabanova et al.
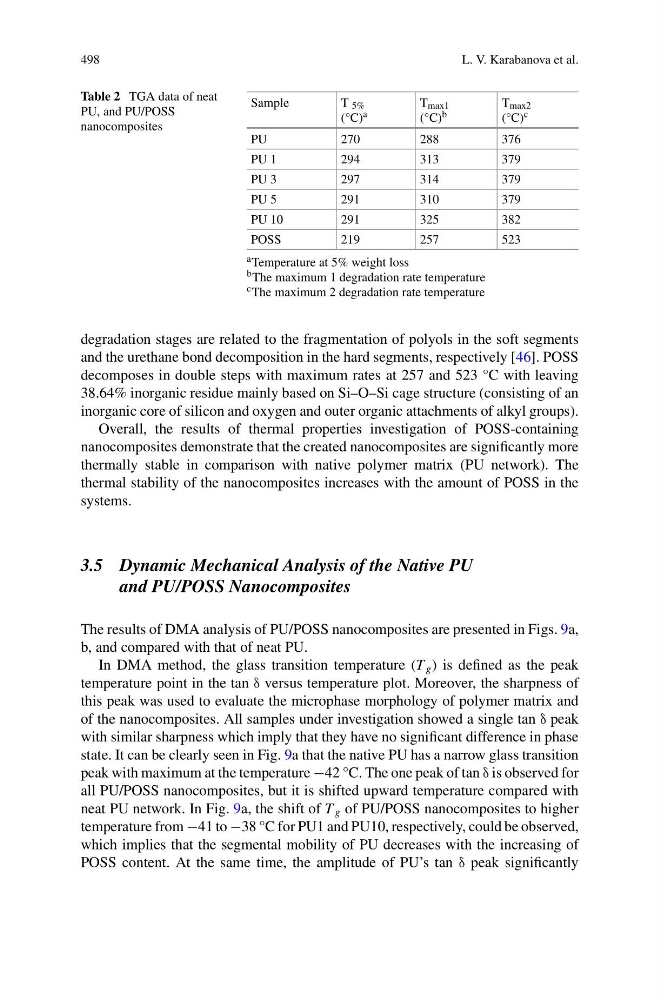
Table 2 TGA data of neat
PU, and PU/POSS
nanocomposites
Sample
T 5%
(°C) a
T max1
(°C) b
T max2
(°C) c
PU
270
288
376
PU 1
294
313
379
PU 3
297
314
379
PU 5
291
310
379
PU 10
291
325
382
POSS
219
257
523
a Temperature at 5% weight loss
b The maximum 1 degradation rate temperature
c The maximum 2 degradation rate temperature
degradation stages are related to the fragmentation of polyols in the soft segments
and the urethane bond decomposition in the hard segments, respectively [46]. POSS
decomposes in double steps with maximum rates at 257 and 523 °C with leaving
38.64% inorganic residue mainly based on Si–O–Si cage structure (consisting of an
inorganic core of silicon and oxygen and outer organic attachments of alkyl groups).
Overall, the results of thermal properties investigation of POSS-containing
nanocomposites demonstrate that the created nanocomposites are significantly more
thermally stable in comparison with native polymer matrix (PU network). The
thermal stability of the nanocomposites increases with the amount of POSS in the
systems.
3.5 Dynamic Mechanical Analysis of the Native PU
and PU/POSS Nanocomposites
The results of DMA analysis of PU/POSS nanocomposites are presented in Figs. 9a,
b, and compared with that of neat PU.
In DMA method, the glass transition temperature (T g ) is defined as the peak
temperature point in the tan δ versus temperature plot. Moreover, the sharpness of
this peak was used to evaluate the microphase morphology of polymer matrix and
of the nanocomposites. All samples under investigation showed a single tan δ peak
with similar sharpness which imply that they have no significant difference in phase
state. It can be clearly seen in Fig. 9a that the native PU has a narrow glass transition
peak with maximum at the temperature −42 °C. The one peak of tan δ is observed for
all PU/POSS nanocomposites, but it is shifted upward temperature compared with
neat PU network. In Fig. 9a, the shift of T g of PU/POSS nanocomposites to higher
temperature from −41 to −38 °C for PU1 and PU10, respectively, could be observed,
which implies that the segmental mobility of PU decreases with the increasing of
POSS content. At the same time, the amplitude of PU’s tan δ peak significantly
L. V. Karabanova et al.
Table 2 TGA data of neat
PU, and PU/POSS
nanocomposites
Sample
T 5%
(°C) a
T max1
(°C) b
T max2
(°C) c
PU
270
288
376
PU 1
294
313
379
PU 3
297
314
379
PU 5
291
310
379
PU 10
291
325
382
POSS
219
257
523
a Temperature at 5% weight loss
b The maximum 1 degradation rate temperature
c The maximum 2 degradation rate temperature
degradation stages are related to the fragmentation of polyols in the soft segments
and the urethane bond decomposition in the hard segments, respectively [46]. POSS
decomposes in double steps with maximum rates at 257 and 523 °C with leaving
38.64% inorganic residue mainly based on Si–O–Si cage structure (consisting of an
inorganic core of silicon and oxygen and outer organic attachments of alkyl groups).
Overall, the results of thermal properties investigation of POSS-containing
nanocomposites demonstrate that the created nanocomposites are significantly more
thermally stable in comparison with native polymer matrix (PU network). The
thermal stability of the nanocomposites increases with the amount of POSS in the
systems.
3.5 Dynamic Mechanical Analysis of the Native PU
and PU/POSS Nanocomposites
The results of DMA analysis of PU/POSS nanocomposites are presented in Figs. 9a,
b, and compared with that of neat PU.
In DMA method, the glass transition temperature (T g ) is defined as the peak
temperature point in the tan δ versus temperature plot. Moreover, the sharpness of
this peak was used to evaluate the microphase morphology of polymer matrix and
of the nanocomposites. All samples under investigation showed a single tan δ peak
with similar sharpness which imply that they have no significant difference in phase
state. It can be clearly seen in Fig. 9a that the native PU has a narrow glass transition
peak with maximum at the temperature −42 °C. The one peak of tan δ is observed for
all PU/POSS nanocomposites, but it is shifted upward temperature compared with
neat PU network. In Fig. 9a, the shift of T g of PU/POSS nanocomposites to higher
temperature from −41 to −38 °C for PU1 and PU10, respectively, could be observed,
which implies that the segmental mobility of PU decreases with the increasing of
POSS content. At the same time, the amplitude of PU’s tan δ peak significantly