

Structure and Properties of the POSS-Containing Nanocomposites …
497
POSS amount, a certain part of the POSS is not implanted but plays a role of the
nanofiller in the system.
3.4 The Thermal Behavior of POSS-Containing
Nanocomposites
Thermal properties of PU and PU/POSS nanocomposites are investigated by TGA
and DSC under nitrogen atmosphere. The related DSC and TGA thermographs of
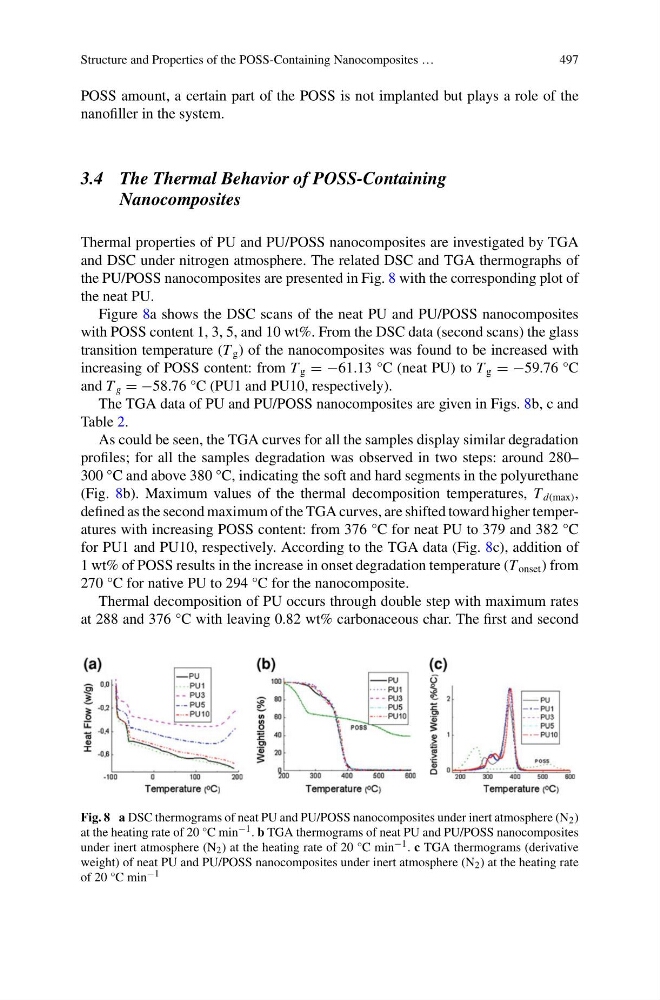
the PU/POSS nanocomposites are presented in Fig. 8 with the corresponding plot of
the neat PU.
Figure 8a shows the DSC scans of the neat PU and PU/POSS nanocomposites
with POSS content 1, 3, 5, and 10 wt%. From the DSC data (second scans) the glass
transition temperature (T g ) of the nanocomposites was found to be increased with
increasing of POSS content: from T g = −61.13 °C (neat PU) to T g = −59.76 °C
and T g = −58.76 °C (PU1 and PU10, respectively).
The TGA data of PU and PU/POSS nanocomposites are given in Figs. 8b, c and
Table 2.
As could be seen, the TGA curves for all the samples display similar degradation
profiles; for all the samples degradation was observed in two steps: around 280–
300 °C and above 380 °C, indicating the soft and hard segments in the polyurethane
(Fig. 8b). Maximum values of the thermal decomposition temperatures, T d(max) ,
defined as the second maximum of the TGA curves, are shifted toward higher temperatures with increasing POSS content: from 376 °C for neat PU to 379 and 382 °C
for PU1 and PU10, respectively. According to the TGA data (Fig. 8c), addition of
1 wt% of POSS results in the increase in onset degradation temperature (T onset ) from
270 °C for native PU to 294 °C for the nanocomposite.
Thermal decomposition of PU occurs through double step with maximum rates
at 288 and 376 °C with leaving 0.82 wt% carbonaceous char. The first and second
Fig. 8 a DSC thermograms of neat PU and PU/POSS nanocomposites under inert atmosphere (N 2 )
at the heating rate of 20 °C min −1 . b TGA thermograms of neat PU and PU/POSS nanocomposites
under inert atmosphere (N 2 ) at the heating rate of 20 °C min −1 . c TGA thermograms (derivative
weight) of neat PU and PU/POSS nanocomposites under inert atmosphere (N 2 ) at the heating rate
of 20 °C min −1
497
POSS amount, a certain part of the POSS is not implanted but plays a role of the
nanofiller in the system.
3.4 The Thermal Behavior of POSS-Containing
Nanocomposites
Thermal properties of PU and PU/POSS nanocomposites are investigated by TGA
and DSC under nitrogen atmosphere. The related DSC and TGA thermographs of
the PU/POSS nanocomposites are presented in Fig. 8 with the corresponding plot of
the neat PU.
Figure 8a shows the DSC scans of the neat PU and PU/POSS nanocomposites
with POSS content 1, 3, 5, and 10 wt%. From the DSC data (second scans) the glass
transition temperature (T g ) of the nanocomposites was found to be increased with
increasing of POSS content: from T g = −61.13 °C (neat PU) to T g = −59.76 °C
and T g = −58.76 °C (PU1 and PU10, respectively).
The TGA data of PU and PU/POSS nanocomposites are given in Figs. 8b, c and
Table 2.
As could be seen, the TGA curves for all the samples display similar degradation
profiles; for all the samples degradation was observed in two steps: around 280–
300 °C and above 380 °C, indicating the soft and hard segments in the polyurethane
(Fig. 8b). Maximum values of the thermal decomposition temperatures, T d(max) ,
defined as the second maximum of the TGA curves, are shifted toward higher temperatures with increasing POSS content: from 376 °C for neat PU to 379 and 382 °C
for PU1 and PU10, respectively. According to the TGA data (Fig. 8c), addition of
1 wt% of POSS results in the increase in onset degradation temperature (T onset ) from
270 °C for native PU to 294 °C for the nanocomposite.
Thermal decomposition of PU occurs through double step with maximum rates
at 288 and 376 °C with leaving 0.82 wt% carbonaceous char. The first and second
Fig. 8 a DSC thermograms of neat PU and PU/POSS nanocomposites under inert atmosphere (N 2 )
at the heating rate of 20 °C min −1 . b TGA thermograms of neat PU and PU/POSS nanocomposites
under inert atmosphere (N 2 ) at the heating rate of 20 °C min −1 . c TGA thermograms (derivative
weight) of neat PU and PU/POSS nanocomposites under inert atmosphere (N 2 ) at the heating rate
of 20 °C min −1