

Epoxy Molecular Structure Alteration in Graphene …
475
domains. Also, both variability of geometric shape and non-uniformity in spatial
distribution of the nanoplatelets over the sample have been ignored in the simulation.
3.3.2 Static Mechanical Loading
The “Shopper” testing machine has been used to compress the samples. The destruction strength (P 0 ) and the static Young’s modules (E 0 ) have been determined from
the strtess-strain curves as five-samples-averaged values. The static Poisson’s ratio
(ν 0 ) have been calculated by [74]:
(1 + ν) = E 0 (1 − 2ν)/6σ F ,
(8)
where σ F is the fluidity limit.
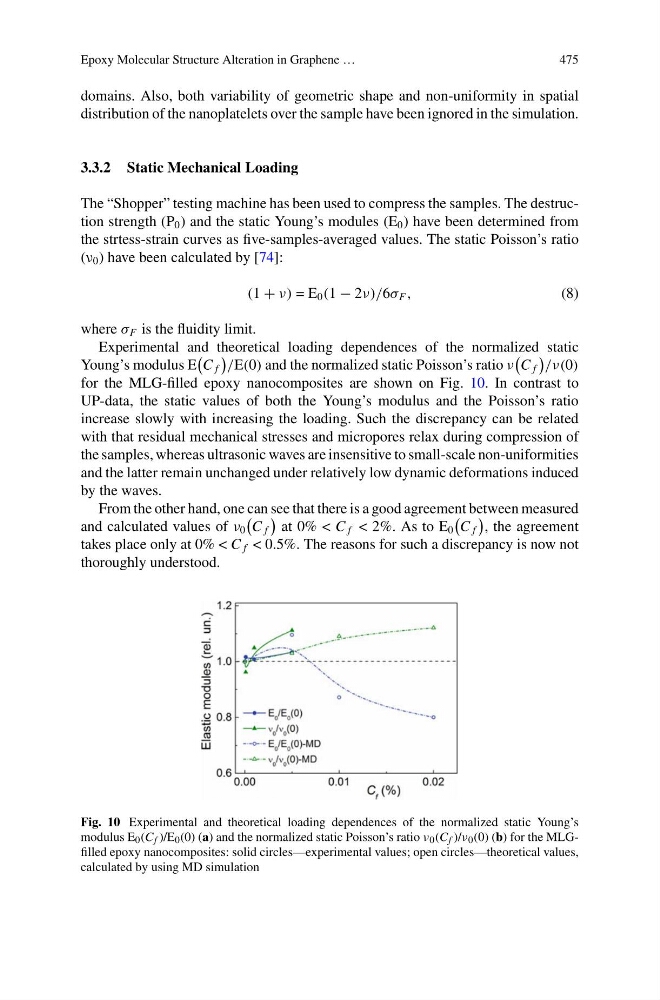
Experimental and theoretical loading dependences of the normalized static
Young’s modulus E
C f
/E(0) and the normalized static Poisson’s ratio ν
C f
/ν(0)
for the MLG-filled epoxy nanocomposites are shown on Fig. 10. In contrast to
UP-data, the static values of both the Young’s modulus and the Poisson’s ratio
increase slowly with increasing the loading. Such the discrepancy can be related
with that residual mechanical stresses and micropores relax during compression of
the samples, whereas ultrasonic waves are insensitive to small-scale non-uniformities
and the latter remain unchanged under relatively low dynamic deformations induced
by the waves.
From the other hand, one can see that there is a good agreement between measured
and calculated values of ν 0
C f
at 0% < C f < 2%. As to E 0
C f
, the agreement
takes place only at 0% < C f < 0.5%. The reasons for such a discrepancy is now not
thoroughly understood.
Fig. 10 Experimental and theoretical loading dependences of the normalized static Young’s
modulus E 0 (C f )/E 0 (0) (a) and the normalized static Poisson’s ratio ν 0 (C f )/ν 0 (0) (b) for the MLGfilled epoxy nanocomposites: solid circles—experimental values; open circles—theoretical values,
calculated by using MD simulation
475
domains. Also, both variability of geometric shape and non-uniformity in spatial
distribution of the nanoplatelets over the sample have been ignored in the simulation.
3.3.2 Static Mechanical Loading
The “Shopper” testing machine has been used to compress the samples. The destruction strength (P 0 ) and the static Young’s modules (E 0 ) have been determined from
the strtess-strain curves as five-samples-averaged values. The static Poisson’s ratio
(ν 0 ) have been calculated by [74]:
(1 + ν) = E 0 (1 − 2ν)/6σ F ,
(8)
where σ F is the fluidity limit.
Experimental and theoretical loading dependences of the normalized static
Young’s modulus E
C f
/E(0) and the normalized static Poisson’s ratio ν
C f
/ν(0)
for the MLG-filled epoxy nanocomposites are shown on Fig. 10. In contrast to
UP-data, the static values of both the Young’s modulus and the Poisson’s ratio
increase slowly with increasing the loading. Such the discrepancy can be related
with that residual mechanical stresses and micropores relax during compression of
the samples, whereas ultrasonic waves are insensitive to small-scale non-uniformities
and the latter remain unchanged under relatively low dynamic deformations induced
by the waves.
From the other hand, one can see that there is a good agreement between measured
and calculated values of ν 0
C f
at 0% < C f < 2%. As to E 0
C f
, the agreement
takes place only at 0% < C f < 0.5%. The reasons for such a discrepancy is now not
thoroughly understood.
Fig. 10 Experimental and theoretical loading dependences of the normalized static Young’s
modulus E 0 (C f )/E 0 (0) (a) and the normalized static Poisson’s ratio ν 0 (C f )/ν 0 (0) (b) for the MLGfilled epoxy nanocomposites: solid circles—experimental values; open circles—theoretical values,
calculated by using MD simulation