

476
B. M. Gorelov et al.
3.4 Data Obtained by Positron Annihilation Life-Time
Spectroscopy
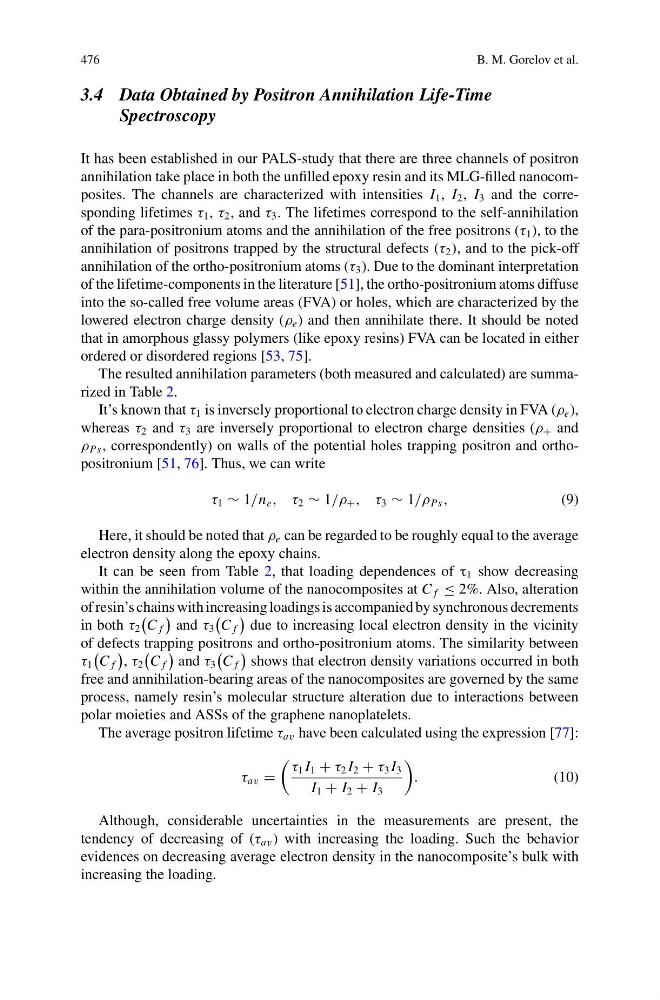
It has been established in our PALS-study that there are three channels of positron
annihilation take place in both the unfilled epoxy resin and its MLG-filled nanocomposites. The channels are characterized with intensities I 1 , I 2 , I 3 and the corresponding lifetimes τ 1 , τ 2 , and τ 3 . The lifetimes correspond to the self-annihilation
of the para-positronium atoms and the annihilation of the free positrons (τ 1 ), to the
annihilation of positrons trapped by the structural defects (τ 2 ), and to the pick-off
annihilation of the ortho-positronium atoms (τ 3 ). Due to the dominant interpretation
of the lifetime-components in the literature [51], the ortho-positronium atoms diffuse
into the so-called free volume areas (FVA) or holes, which are characterized by the
lowered electron charge density (ρ e ) and then annihilate there. It should be noted
that in amorphous glassy polymers (like epoxy resins) FVA can be located in either
ordered or disordered regions [53, 75].
The resulted annihilation parameters (both measured and calculated) are summarized in Table 2.
It’s known that τ 1 is inversely proportional to electron charge density in FVA (ρ e ),
whereas τ 2 and τ 3 are inversely proportional to electron charge densities (ρ + and
ρ Ps , correspondently) on walls of the potential holes trapping positron and orthopositronium [51, 76]. Thus, we can write
τ 1 ∼ 1/n e , τ 2 ∼ 1/ρ + , τ 3 ∼ 1/ρ Ps ,
(9)
Here, it should be noted that ρ e can be regarded to be roughly equal to the average
electron density along the epoxy chains.
It can be seen from Table 2, that loading dependences of τ 1 show decreasing
within the annihilation volume of the nanocomposites at C f ≤ 2%. Also, alteration
of resin’s chains with increasing loadings is accompanied by synchronous decrements
in both τ 2
C f
and τ 3
C f
due to increasing local electron density in the vicinity
of defects trapping positrons and ortho-positronium atoms. The similarity between
τ 1
C f
, τ 2
C f
and τ 3
C f
shows that electron density variations occurred in both
free and annihilation-bearing areas of the nanocomposites are governed by the same
process, namely resin’s molecular structure alteration due to interactions between
polar moieties and ASSs of the graphene nanoplatelets.
The average positron lifetime τ av have been calculated using the expression [77]:
τ av =
τ 1 I 1 + τ 2 I 2 + τ 3 I 3
I 1 + I 2 + I 3
.
(10)
Although, considerable uncertainties in the measurements are present, the
tendency of decreasing of (τ av ) with increasing the loading. Such the behavior
evidences on decreasing average electron density in the nanocomposite’s bulk with
increasing the loading.
B. M. Gorelov et al.
3.4 Data Obtained by Positron Annihilation Life-Time
Spectroscopy
It has been established in our PALS-study that there are three channels of positron
annihilation take place in both the unfilled epoxy resin and its MLG-filled nanocomposites. The channels are characterized with intensities I 1 , I 2 , I 3 and the corresponding lifetimes τ 1 , τ 2 , and τ 3 . The lifetimes correspond to the self-annihilation
of the para-positronium atoms and the annihilation of the free positrons (τ 1 ), to the
annihilation of positrons trapped by the structural defects (τ 2 ), and to the pick-off
annihilation of the ortho-positronium atoms (τ 3 ). Due to the dominant interpretation
of the lifetime-components in the literature [51], the ortho-positronium atoms diffuse
into the so-called free volume areas (FVA) or holes, which are characterized by the
lowered electron charge density (ρ e ) and then annihilate there. It should be noted
that in amorphous glassy polymers (like epoxy resins) FVA can be located in either
ordered or disordered regions [53, 75].
The resulted annihilation parameters (both measured and calculated) are summarized in Table 2.
It’s known that τ 1 is inversely proportional to electron charge density in FVA (ρ e ),
whereas τ 2 and τ 3 are inversely proportional to electron charge densities (ρ + and
ρ Ps , correspondently) on walls of the potential holes trapping positron and orthopositronium [51, 76]. Thus, we can write
τ 1 ∼ 1/n e , τ 2 ∼ 1/ρ + , τ 3 ∼ 1/ρ Ps ,
(9)
Here, it should be noted that ρ e can be regarded to be roughly equal to the average
electron density along the epoxy chains.
It can be seen from Table 2, that loading dependences of τ 1 show decreasing
within the annihilation volume of the nanocomposites at C f ≤ 2%. Also, alteration
of resin’s chains with increasing loadings is accompanied by synchronous decrements
in both τ 2
C f
and τ 3
C f
due to increasing local electron density in the vicinity
of defects trapping positrons and ortho-positronium atoms. The similarity between
τ 1
C f
, τ 2
C f
and τ 3
C f
shows that electron density variations occurred in both
free and annihilation-bearing areas of the nanocomposites are governed by the same
process, namely resin’s molecular structure alteration due to interactions between
polar moieties and ASSs of the graphene nanoplatelets.
The average positron lifetime τ av have been calculated using the expression [77]:
τ av =
τ 1 I 1 + τ 2 I 2 + τ 3 I 3
I 1 + I 2 + I 3
.
(10)
Although, considerable uncertainties in the measurements are present, the
tendency of decreasing of (τ av ) with increasing the loading. Such the behavior
evidences on decreasing average electron density in the nanocomposite’s bulk with
increasing the loading.