

Modeling Multilayer Pyramidal-Like Adsorbate Structures …
433
be less than one for the surface characterized by the larger portion of the surface
features far from the mean surface level. Evolution of interface width, skewness,
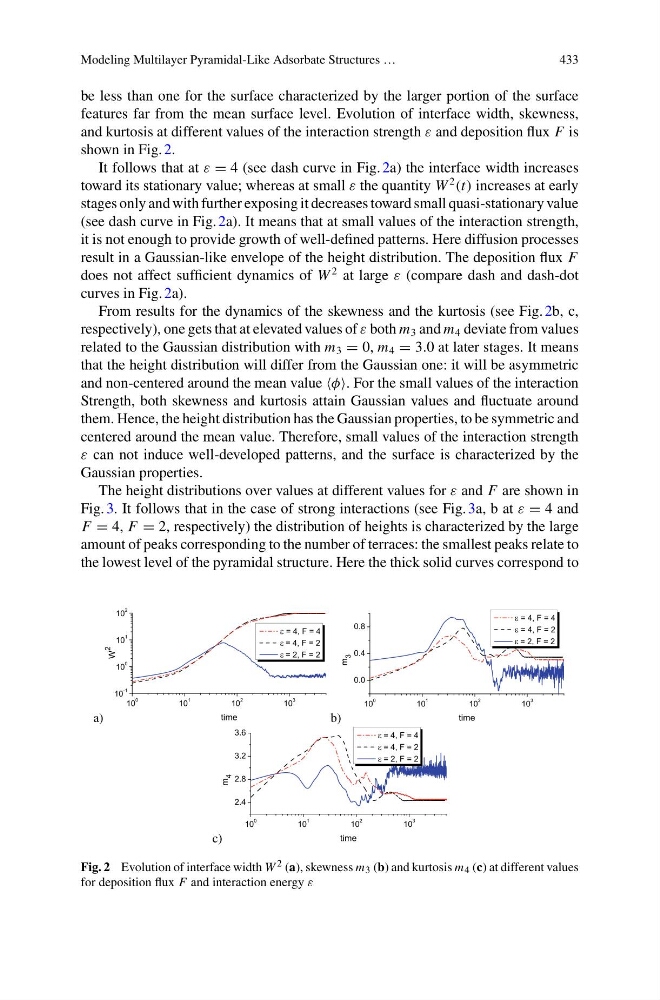
and kurtosis at different values of the interaction strength ε and deposition flux F is
shown in Fig. 2.
It follows that at ε = 4 (see dash curve in Fig. 2a) the interface width increases
toward its stationary value; whereas at small ε the quantity W
2
(t) increases at early
stages only and with further exposing it decreases toward small quasi-stationary value
(see dash curve in Fig. 2a). It means that at small values of the interaction strength,
it is not enough to provide growth of well-defined patterns. Here diffusion processes
result in a Gaussian-like envelope of the height distribution. The deposition flux F
does not affect sufficient dynamics of W
2 at large ε (compare dash and dash-dot
curves in Fig. 2a).
From results for the dynamics of the skewness and the kurtosis (see Fig. 2b, c,
respectively), one gets that at elevated values of ε both m 3 and m 4 deviate from values
related to the Gaussian distribution with m 3 = 0, m 4 = 3.0 at later stages. It means
that the height distribution will differ from the Gaussian one: it will be asymmetric
and non-centered around the mean value For the small values of the interaction
Strength, both skewness and kurtosis attain Gaussian values and fluctuate around
them. Hence, the height distribution has the Gaussian properties, to be symmetric and
centered around the mean value. Therefore, small values of the interaction strength
ε can not induce well-developed patterns, and the surface is characterized by the
Gaussian properties.
The height distributions over values at different values for ε and F are shown in
Fig. 3. It follows that in the case of strong interactions (see Fig. 3a, b at ε = 4 and
F = 4, F = 2, respectively) the distribution of heights is characterized by the large
amount of peaks corresponding to the number of terraces: the smallest peaks relate to
the lowest level of the pyramidal structure. Here the thick solid curves correspond to
Fig. 2 Evolution of interface width W 2 (a), skewness m 3 (b) and kurtosis m 4 (c) at different values
for deposition flux F and interaction energy ε
433
be less than one for the surface characterized by the larger portion of the surface
features far from the mean surface level. Evolution of interface width, skewness,
and kurtosis at different values of the interaction strength ε and deposition flux F is
shown in Fig. 2.
It follows that at ε = 4 (see dash curve in Fig. 2a) the interface width increases
toward its stationary value; whereas at small ε the quantity W
2
(t) increases at early
stages only and with further exposing it decreases toward small quasi-stationary value
(see dash curve in Fig. 2a). It means that at small values of the interaction strength,
it is not enough to provide growth of well-defined patterns. Here diffusion processes
result in a Gaussian-like envelope of the height distribution. The deposition flux F
does not affect sufficient dynamics of W
2 at large ε (compare dash and dash-dot
curves in Fig. 2a).
From results for the dynamics of the skewness and the kurtosis (see Fig. 2b, c,
respectively), one gets that at elevated values of ε both m 3 and m 4 deviate from values
related to the Gaussian distribution with m 3 = 0, m 4 = 3.0 at later stages. It means
that the height distribution will differ from the Gaussian one: it will be asymmetric
and non-centered around the mean value For the small values of the interaction
Strength, both skewness and kurtosis attain Gaussian values and fluctuate around
them. Hence, the height distribution has the Gaussian properties, to be symmetric and
centered around the mean value. Therefore, small values of the interaction strength
ε can not induce well-developed patterns, and the surface is characterized by the
Gaussian properties.
The height distributions over values at different values for ε and F are shown in
Fig. 3. It follows that in the case of strong interactions (see Fig. 3a, b at ε = 4 and
F = 4, F = 2, respectively) the distribution of heights is characterized by the large
amount of peaks corresponding to the number of terraces: the smallest peaks relate to
the lowest level of the pyramidal structure. Here the thick solid curves correspond to
Fig. 2 Evolution of interface width W 2 (a), skewness m 3 (b) and kurtosis m 4 (c) at different values
for deposition flux F and interaction energy ε