

434
A. V. Dvornichenko and O. M. Shchokotova
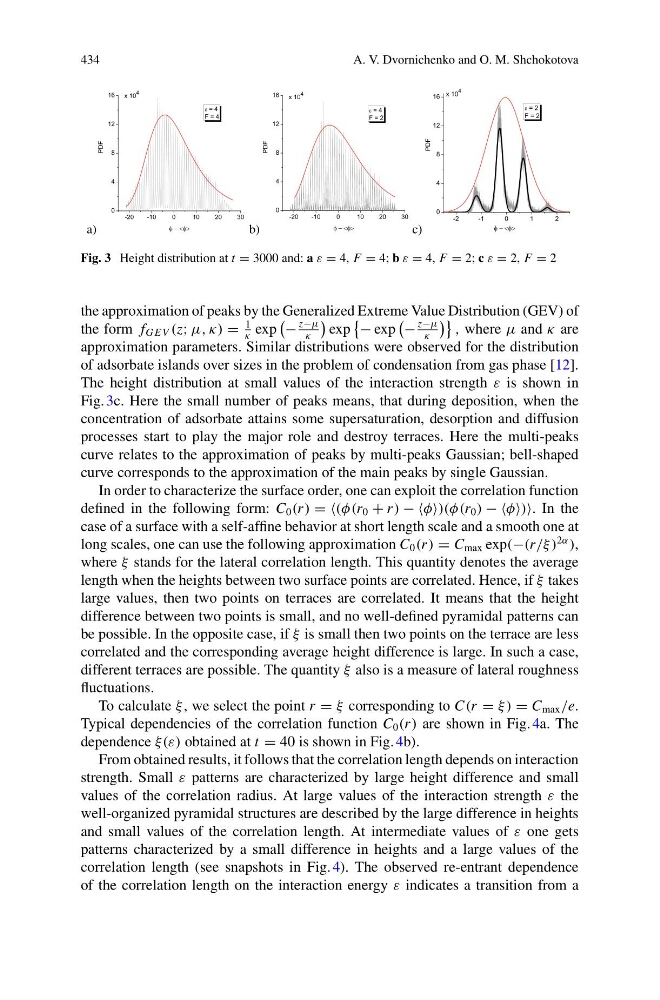
Fig. 3 Height distribution at t = 3000 and: a ε = 4, F = 4; b ε = 4, F = 2; c ε = 2, F = 2
the approximation of peaks by the Generalized Extreme Value Distribution (GEV) of
the form f G E V (z; μ, κ) =
1
κ
exp
−
z−μ
κ
exp
− exp
−
z−μ
κ
, where μ and κ are
approximation parameters. Similar distributions were observed for the distribution
of adsorbate islands over sizes in the problem of condensation from gas phase [12].
The height distribution at small values of the interaction strength ε is shown in
Fig. 3c. Here the small number of peaks means, that during deposition, when the
concentration of adsorbate attains some supersaturation, desorption and diffusion
processes start to play the major role and destroy terraces. Here the multi-peaks
curve relates to the approximation of peaks by multi-peaks Gaussian; bell-shaped
curve corresponds to the approximation of the main peaks by single Gaussian.
In order to characterize the surface order, one can exploit the correlation function
defined in the following form: C 0 (r ) = =(φ(r 0 + r ) − −φ)(φ(r 0 ) − −φ In the
case of a surface with a self-affine behavior at short length scale and a smooth one at
long scales, one can use the following approximation C 0 (r ) = C max exp(−(r/ξ )
2α
),
where ξ stands for the lateral correlation length. This quantity denotes the average
length when the heights between two surface points are correlated. Hence, if ξ takes
large values, then two points on terraces are correlated. It means that the height
difference between two points is small, and no well-defined pyramidal patterns can
be possible. In the opposite case, if ξ is small then two points on the terrace are less
correlated and the corresponding average height difference is large. In such a case,
different terraces are possible. The quantity ξ also is a measure of lateral roughness
fluctuations.
To calculate ξ , we select the point r = ξ corresponding to C(r = ξ) = C max /e.
Typical dependencies of the correlation function C 0 (r ) are shown in Fig. 4a. The
dependence ξ(ε) obtained at t = 40 is shown in Fig. 4b).
From obtained results, it follows that the correlation length depends on interaction
strength. Small ε patterns are characterized by large height difference and small
values of the correlation radius. At large values of the interaction strength ε the
well-organized pyramidal structures are described by the large difference in heights
and small values of the correlation length. At intermediate values of ε one gets
patterns characterized by a small difference in heights and a large values of the
correlation length (see snapshots in Fig. 4). The observed re-entrant dependence
of the correlation length on the interaction energy ε indicates a transition from a
A. V. Dvornichenko and O. M. Shchokotova
Fig. 3 Height distribution at t = 3000 and: a ε = 4, F = 4; b ε = 4, F = 2; c ε = 2, F = 2
the approximation of peaks by the Generalized Extreme Value Distribution (GEV) of
the form f G E V (z; μ, κ) =
1
κ
exp
−
z−μ
κ
exp
− exp
−
z−μ
κ
, where μ and κ are
approximation parameters. Similar distributions were observed for the distribution
of adsorbate islands over sizes in the problem of condensation from gas phase [12].
The height distribution at small values of the interaction strength ε is shown in
Fig. 3c. Here the small number of peaks means, that during deposition, when the
concentration of adsorbate attains some supersaturation, desorption and diffusion
processes start to play the major role and destroy terraces. Here the multi-peaks
curve relates to the approximation of peaks by multi-peaks Gaussian; bell-shaped
curve corresponds to the approximation of the main peaks by single Gaussian.
In order to characterize the surface order, one can exploit the correlation function
defined in the following form: C 0 (r ) = =(φ(r 0 + r ) − −φ)(φ(r 0 ) − −φ In the
case of a surface with a self-affine behavior at short length scale and a smooth one at
long scales, one can use the following approximation C 0 (r ) = C max exp(−(r/ξ )
2α
),
where ξ stands for the lateral correlation length. This quantity denotes the average
length when the heights between two surface points are correlated. Hence, if ξ takes
large values, then two points on terraces are correlated. It means that the height
difference between two points is small, and no well-defined pyramidal patterns can
be possible. In the opposite case, if ξ is small then two points on the terrace are less
correlated and the corresponding average height difference is large. In such a case,
different terraces are possible. The quantity ξ also is a measure of lateral roughness
fluctuations.
To calculate ξ , we select the point r = ξ corresponding to C(r = ξ) = C max /e.
Typical dependencies of the correlation function C 0 (r ) are shown in Fig. 4a. The
dependence ξ(ε) obtained at t = 40 is shown in Fig. 4b).
From obtained results, it follows that the correlation length depends on interaction
strength. Small ε patterns are characterized by large height difference and small
values of the correlation radius. At large values of the interaction strength ε the
well-organized pyramidal structures are described by the large difference in heights
and small values of the correlation length. At intermediate values of ε one gets
patterns characterized by a small difference in heights and a large values of the
correlation length (see snapshots in Fig. 4). The observed re-entrant dependence
of the correlation length on the interaction energy ε indicates a transition from a