

414
T. L. Tsaregradskaya et al.
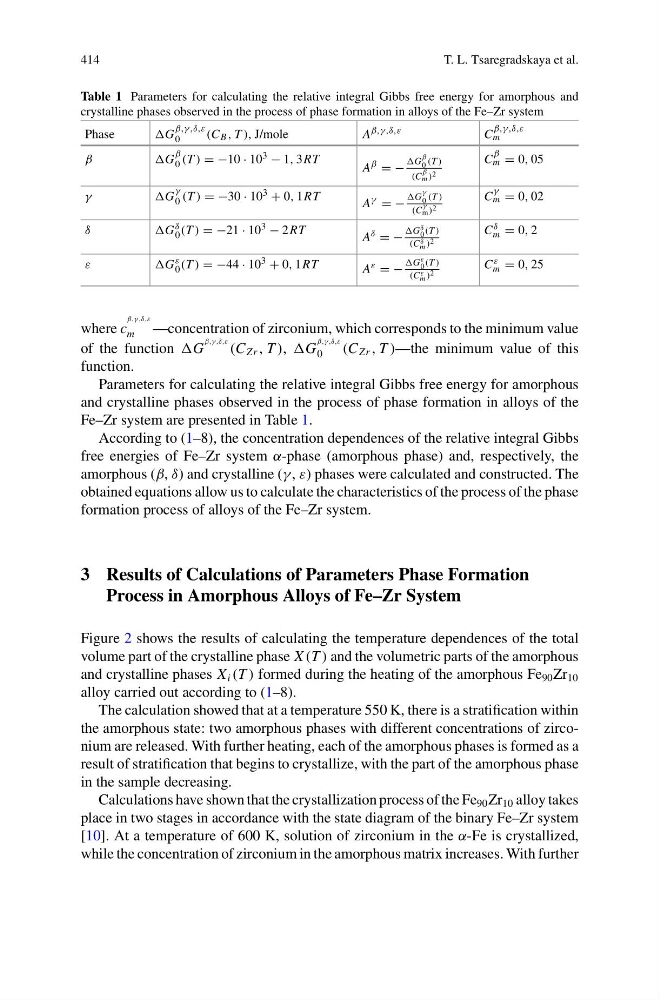
Table 1 Parameters for calculating the relative integral Gibbs free energy for amorphous and
crystalline phases observed in the process of phase formation in alloys of the Fe–Zr system
Phase
G
β,γ,δ,ε
0
(C B , T ), J/mole
A β,γ,δ,ε
C
β,γ,δ,ε
m
β
G
β
0 (T ) = −10 · 10 3 − 1, 3RT
A β = −
G
β
0 (T )
(C
β
m ) 2
C
β
m = 0, 05
γ
G
γ
0 (T ) = −30 · 10 3 + 0, 1RT
A γ = −
G
γ
0 (T )
(C
γ
m ) 2
C
γ
m = 0, 02
δ
G δ
0 (T ) = −21 · 10 3 − 2RT
A δ = −
G δ
0 (T )
(C δ
m ) 2
C δ
m = 0, 2
ε
G ε
0 (T ) = −44 · 10 3 + 0, 1RT
A ε = −
G ε
0 (T )
(C ε
m ) 2
C ε
m = 0, 25
where c
β,γ,δ,ε
m
—concentration of zirconium, which corresponds to the minimum value
of the function G
β,γ,δ,ε (C Zr , T ), G
β,γ,δ,ε
0
(C Zr , T )—the minimum value of this
function.
Parameters for calculating the relative integral Gibbs free energy for amorphous
and crystalline phases observed in the process of phase formation in alloys of the
Fe–Zr system are presented in Table 1.
According to (1–8), the concentration dependences of the relative integral Gibbs
free energies of Fe–Zr system α-phase (amorphous phase) and, respectively, the
amorphous (β, δ) and crystalline (γ , ε) phases were calculated and constructed. The
obtained equations allow us to calculate the characteristics of the process of the phase
formation process of alloys of the Fe–Zr system.
3 Results of Calculations of Parameters Phase Formation
Process in Amorphous Alloys of Fe–Zr System
Figure 2 shows the results of calculating the temperature dependences of the total
volume part of the crystalline phase X (T ) and the volumetric parts of the amorphous
and crystalline phases X i (T ) formed during the heating of the amorphous Fe 90 Zr 10
alloy carried out according to (1–8).
The calculation showed that at a temperature 550 K, there is a stratification within
the amorphous state: two amorphous phases with different concentrations of zirconium are released. With further heating, each of the amorphous phases is formed as a
result of stratification that begins to crystallize, with the part of the amorphous phase
in the sample decreasing.
Calculations have shown that the crystallization process of the Fe 90 Zr 10 alloy takes
place in two stages in accordance with the state diagram of the binary Fe–Zr system
[10]. At a temperature of 600 K, solution of zirconium in the α-Fe is crystallized,
while the concentration of zirconium in the amorphous matrix increases. With further
T. L. Tsaregradskaya et al.
Table 1 Parameters for calculating the relative integral Gibbs free energy for amorphous and
crystalline phases observed in the process of phase formation in alloys of the Fe–Zr system
Phase
G
β,γ,δ,ε
0
(C B , T ), J/mole
A β,γ,δ,ε
C
β,γ,δ,ε
m
β
G
β
0 (T ) = −10 · 10 3 − 1, 3RT
A β = −
G
β
0 (T )
(C
β
m ) 2
C
β
m = 0, 05
γ
G
γ
0 (T ) = −30 · 10 3 + 0, 1RT
A γ = −
G
γ
0 (T )
(C
γ
m ) 2
C
γ
m = 0, 02
δ
G δ
0 (T ) = −21 · 10 3 − 2RT
A δ = −
G δ
0 (T )
(C δ
m ) 2
C δ
m = 0, 2
ε
G ε
0 (T ) = −44 · 10 3 + 0, 1RT
A ε = −
G ε
0 (T )
(C ε
m ) 2
C ε
m = 0, 25
where c
β,γ,δ,ε
m
—concentration of zirconium, which corresponds to the minimum value
of the function G
β,γ,δ,ε (C Zr , T ), G
β,γ,δ,ε
0
(C Zr , T )—the minimum value of this
function.
Parameters for calculating the relative integral Gibbs free energy for amorphous
and crystalline phases observed in the process of phase formation in alloys of the
Fe–Zr system are presented in Table 1.
According to (1–8), the concentration dependences of the relative integral Gibbs
free energies of Fe–Zr system α-phase (amorphous phase) and, respectively, the
amorphous (β, δ) and crystalline (γ , ε) phases were calculated and constructed. The
obtained equations allow us to calculate the characteristics of the process of the phase
formation process of alloys of the Fe–Zr system.
3 Results of Calculations of Parameters Phase Formation
Process in Amorphous Alloys of Fe–Zr System
Figure 2 shows the results of calculating the temperature dependences of the total
volume part of the crystalline phase X (T ) and the volumetric parts of the amorphous
and crystalline phases X i (T ) formed during the heating of the amorphous Fe 90 Zr 10
alloy carried out according to (1–8).
The calculation showed that at a temperature 550 K, there is a stratification within
the amorphous state: two amorphous phases with different concentrations of zirconium are released. With further heating, each of the amorphous phases is formed as a
result of stratification that begins to crystallize, with the part of the amorphous phase
in the sample decreasing.
Calculations have shown that the crystallization process of the Fe 90 Zr 10 alloy takes
place in two stages in accordance with the state diagram of the binary Fe–Zr system
[10]. At a temperature of 600 K, solution of zirconium in the α-Fe is crystallized,
while the concentration of zirconium in the amorphous matrix increases. With further