

Features of Phase Formation Processes in Amorphous Alloys …
413
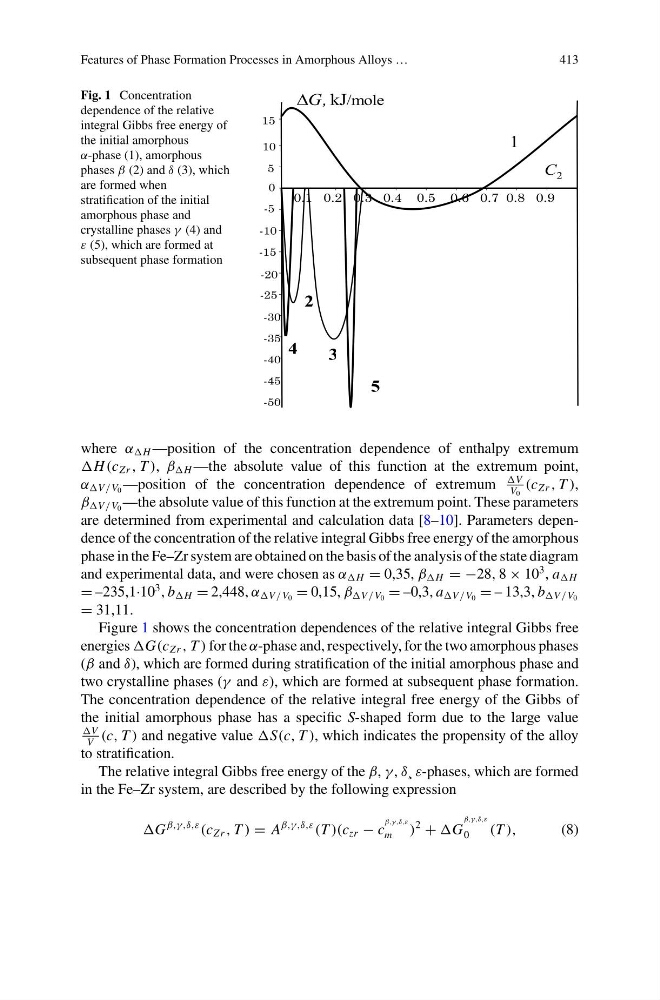
Fig. 1 Concentration
dependence of the relative
integral Gibbs free energy of
the initial amorphous
α-phase (1), amorphous
phases β (2) and δ (3), which
are formed when
stratification of the initial
amorphous phase and
crystalline phases γ (4) and
ε (5), which are formed at
subsequent phase formation
where α H —position of the concentration dependence of enthalpy extremum
(c Zr , T ), β —the absolute value of this function at the extremum point,
α /V 0 —position of the concentration dependence of extremum
V 0
(c Zr , T ),
β /V 0 —the absolute value of this function at the extremum point. These parameters
are determined from experimental and calculation data [8–10]. Parameters dependence of the concentration of the relative integral Gibbs free energy of the amorphous
phase in the Fe–Zr system are obtained on the basis of the analysis of the state diagram
and experimental data, and were chosen as α = 0,35, β H = −28, 8 × 10
3 , a
= –235,1·10
3 , b = 2,448, α /V 0 = 0,15, β /V 0 = –0,3, a /V 0 = – 13,3, b /V 0
= 31,11.
Figure 1 shows the concentration dependences of the relative integral Gibbs free
energies Zr , T ) for the α-phase and, respectively, for the two amorphous phases
(β and δ), which are formed during stratification of the initial amorphous phase and
two crystalline phases (γ and ε), which are formed at subsequent phase formation.
The concentration dependence of the relative integral free energy of the Gibbs of
the initial amorphous phase has a specific S-shaped form due to the large value
V
(c, T ) and negative value T ), which indicates the propensity of the alloy
to stratification.
The relative integral Gibbs free energy of the β, γ , δ¸ ε-phases, which are formed
in the Fe–Zr system, are described by the following expression
β,γ,δ,ε
(c Zr , T ) = A
β,γ,δ,ε
(T )(c zr − c
β,γ,δ,ε
m
)
2
+
β,γ,δ,ε
0
(T ),
(8)
413
Fig. 1 Concentration
dependence of the relative
integral Gibbs free energy of
the initial amorphous
α-phase (1), amorphous
phases β (2) and δ (3), which
are formed when
stratification of the initial
amorphous phase and
crystalline phases γ (4) and
ε (5), which are formed at
subsequent phase formation
where α H —position of the concentration dependence of enthalpy extremum
(c Zr , T ), β —the absolute value of this function at the extremum point,
α /V 0 —position of the concentration dependence of extremum
V 0
(c Zr , T ),
β /V 0 —the absolute value of this function at the extremum point. These parameters
are determined from experimental and calculation data [8–10]. Parameters dependence of the concentration of the relative integral Gibbs free energy of the amorphous
phase in the Fe–Zr system are obtained on the basis of the analysis of the state diagram
and experimental data, and were chosen as α = 0,35, β H = −28, 8 × 10
3 , a
= –235,1·10
3 , b = 2,448, α /V 0 = 0,15, β /V 0 = –0,3, a /V 0 = – 13,3, b /V 0
= 31,11.
Figure 1 shows the concentration dependences of the relative integral Gibbs free
energies Zr , T ) for the α-phase and, respectively, for the two amorphous phases
(β and δ), which are formed during stratification of the initial amorphous phase and
two crystalline phases (γ and ε), which are formed at subsequent phase formation.
The concentration dependence of the relative integral free energy of the Gibbs of
the initial amorphous phase has a specific S-shaped form due to the large value
V
(c, T ) and negative value T ), which indicates the propensity of the alloy
to stratification.
The relative integral Gibbs free energy of the β, γ , δ¸ ε-phases, which are formed
in the Fe–Zr system, are described by the following expression
β,γ,δ,ε
(c Zr , T ) = A
β,γ,δ,ε
(T )(c zr − c
β,γ,δ,ε
m
)
2
+
β,γ,δ,ε
0
(T ),
(8)