

370
T. A. Khalyavka et al.
3.4 FTIR Studies
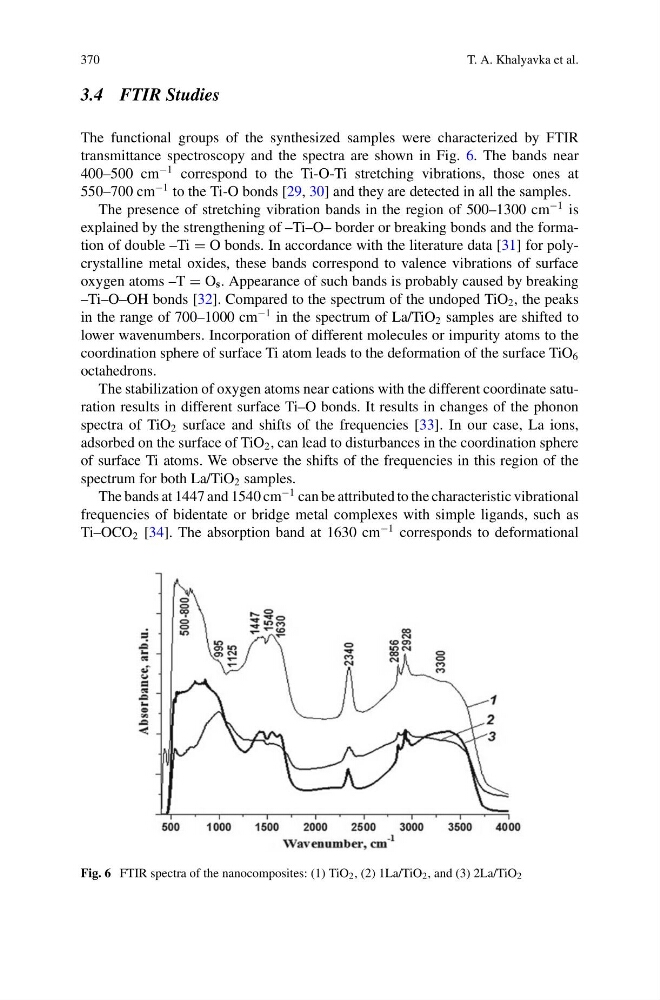
The functional groups of the synthesized samples were characterized by FTIR
transmittance spectroscopy and the spectra are shown in Fig. 6. The bands near
400–500 cm
−1 correspond to the Ti-O-Ti stretching vibrations, those ones at
550–700 cm
−1 to the Ti-O bonds [29, 30] and they are detected in all the samples.
The presence of stretching vibration bands in the region of 500–1300 cm
−1 is
explained by the strengthening of –Ti–O– border or breaking bonds and the formation of double –Ti = O bonds. In accordance with the literature data [31] for polycrystalline metal oxides, these bands correspond to valence vibrations of surface
oxygen atoms –T = O s . Appearance of such bands is probably caused by breaking
–Ti–O–OH bonds [32]. Compared to the spectrum of the undoped TiO 2 , the peaks
in the range of 700–1000 cm
−1 in the spectrum of La/TiO 2 samples are shifted to
lower wavenumbers. Incorporation of different molecules or impurity atoms to the
coordination sphere of surface Ti atom leads to the deformation of the surface TiO 6
octahedrons.
The stabilization of oxygen atoms near cations with the different coordinate saturation results in different surface Ti–O bonds. It results in changes of the phonon
spectra of TiO 2 surface and shifts of the frequencies [33]. In our case, La ions,
adsorbed on the surface of TiO 2 , can lead to disturbances in the coordination sphere
of surface Ti atoms. We observe the shifts of the frequencies in this region of the
spectrum for both La/TiO 2 samples.
The bands at 1447 and 1540 cm
−1 can be attributed to the characteristic vibrational
frequencies of bidentate or bridge metal complexes with simple ligands, such as
Ti–OCO 2 [34]. The absorption band at 1630 cm
−1 corresponds to deformational
Fig. 6 FTIR spectra of the nanocomposites: (1) TiO 2 , (2) 1La/TiO 2 , and (3) 2La/TiO 2
T. A. Khalyavka et al.
3.4 FTIR Studies
The functional groups of the synthesized samples were characterized by FTIR
transmittance spectroscopy and the spectra are shown in Fig. 6. The bands near
400–500 cm
−1 correspond to the Ti-O-Ti stretching vibrations, those ones at
550–700 cm
−1 to the Ti-O bonds [29, 30] and they are detected in all the samples.
The presence of stretching vibration bands in the region of 500–1300 cm
−1 is
explained by the strengthening of –Ti–O– border or breaking bonds and the formation of double –Ti = O bonds. In accordance with the literature data [31] for polycrystalline metal oxides, these bands correspond to valence vibrations of surface
oxygen atoms –T = O s . Appearance of such bands is probably caused by breaking
–Ti–O–OH bonds [32]. Compared to the spectrum of the undoped TiO 2 , the peaks
in the range of 700–1000 cm
−1 in the spectrum of La/TiO 2 samples are shifted to
lower wavenumbers. Incorporation of different molecules or impurity atoms to the
coordination sphere of surface Ti atom leads to the deformation of the surface TiO 6
octahedrons.
The stabilization of oxygen atoms near cations with the different coordinate saturation results in different surface Ti–O bonds. It results in changes of the phonon
spectra of TiO 2 surface and shifts of the frequencies [33]. In our case, La ions,
adsorbed on the surface of TiO 2 , can lead to disturbances in the coordination sphere
of surface Ti atoms. We observe the shifts of the frequencies in this region of the
spectrum for both La/TiO 2 samples.
The bands at 1447 and 1540 cm
−1 can be attributed to the characteristic vibrational
frequencies of bidentate or bridge metal complexes with simple ligands, such as
Ti–OCO 2 [34]. The absorption band at 1630 cm
−1 corresponds to deformational
Fig. 6 FTIR spectra of the nanocomposites: (1) TiO 2 , (2) 1La/TiO 2 , and (3) 2La/TiO 2