

Formation of Manganese-Containing PEO Coatings on Aluminum Alloys
343
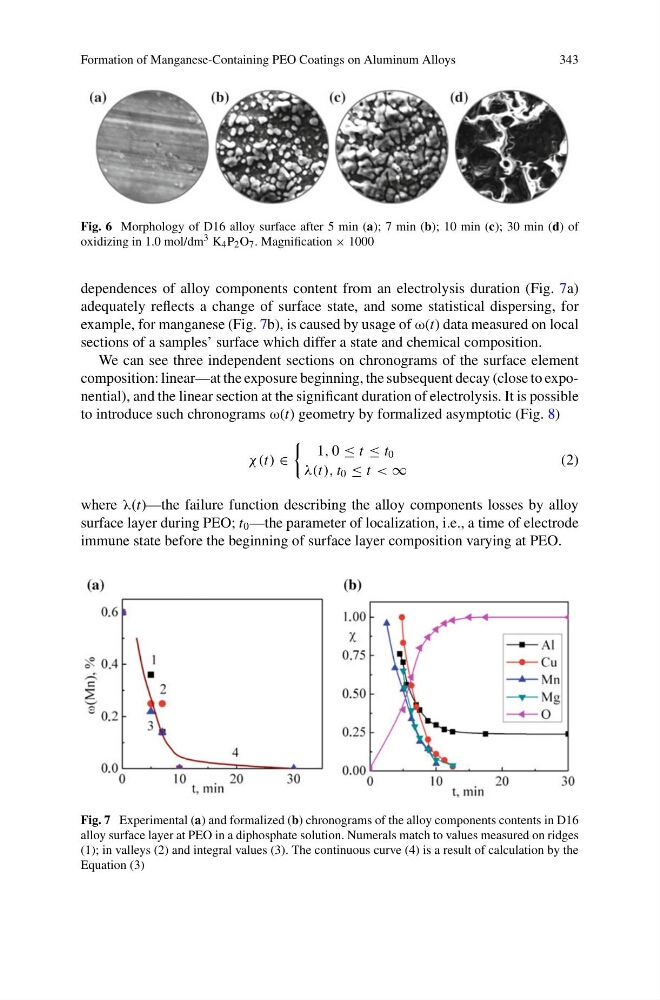
Fig. 6 Morphology of D16 alloy surface after 5 min (a); 7 min (b); 10 min (c); 30 min (d) of
oxidizing in 1.0 mol/dm 3 K 4 P 2 O 7 . Magnification × 1000
dependences of alloy components content from an electrolysis duration (Fig. 7a)
adequately reflects a change of surface state, and some statistical dispersing, for
example, for manganese (Fig. 7b), is caused by usage of ω(t) data measured on local
sections of a samples’ surface which differ a state and chemical composition.
We can see three independent sections on chronograms of the surface element
composition: linear—at the exposure beginning, the subsequent decay (close to exponential), and the linear section at the significant duration of electrolysis. It is possible
to introduce such chronograms ω(t) geometry by formalized asymptotic (Fig. 8)
χ (t) ∈
1, 0 ≤ t ≤ t 0
λ(t), t 0 ≤ t < ∞
(2)
where λ(t)—the failure function describing the alloy components losses by alloy
surface layer during PEO; t 0 —the parameter of localization, i.e., a time of electrode
immune state before the beginning of surface layer composition varying at PEO.
Fig. 7 Experimental (a) and formalized (b) chronograms of the alloy components contents in D16
alloy surface layer at PEO in a diphosphate solution. Numerals match to values measured on ridges
(1); in valleys (2) and integral values (3). The continuous curve (4) is a result of calculation by the
Equation (3)
343
Fig. 6 Morphology of D16 alloy surface after 5 min (a); 7 min (b); 10 min (c); 30 min (d) of
oxidizing in 1.0 mol/dm 3 K 4 P 2 O 7 . Magnification × 1000
dependences of alloy components content from an electrolysis duration (Fig. 7a)
adequately reflects a change of surface state, and some statistical dispersing, for
example, for manganese (Fig. 7b), is caused by usage of ω(t) data measured on local
sections of a samples’ surface which differ a state and chemical composition.
We can see three independent sections on chronograms of the surface element
composition: linear—at the exposure beginning, the subsequent decay (close to exponential), and the linear section at the significant duration of electrolysis. It is possible
to introduce such chronograms ω(t) geometry by formalized asymptotic (Fig. 8)
χ (t) ∈
1, 0 ≤ t ≤ t 0
λ(t), t 0 ≤ t < ∞
(2)
where λ(t)—the failure function describing the alloy components losses by alloy
surface layer during PEO; t 0 —the parameter of localization, i.e., a time of electrode
immune state before the beginning of surface layer composition varying at PEO.
Fig. 7 Experimental (a) and formalized (b) chronograms of the alloy components contents in D16
alloy surface layer at PEO in a diphosphate solution. Numerals match to values measured on ridges
(1); in valleys (2) and integral values (3). The continuous curve (4) is a result of calculation by the
Equation (3)