

56
V. Demchenko et al.
Table 3.1 Structural parameters and temperature transitions for the investigated polymer systems
Polymer system
l p , nm
Q , rel. units
µ g , ◦ C
µ f , ◦ C
ε, % (µ = 140 ◦ C)
IPEC
35
10
63
207
23
IMC
43
24
57
199
18
IPEC–Ag
15
39
65
212
10
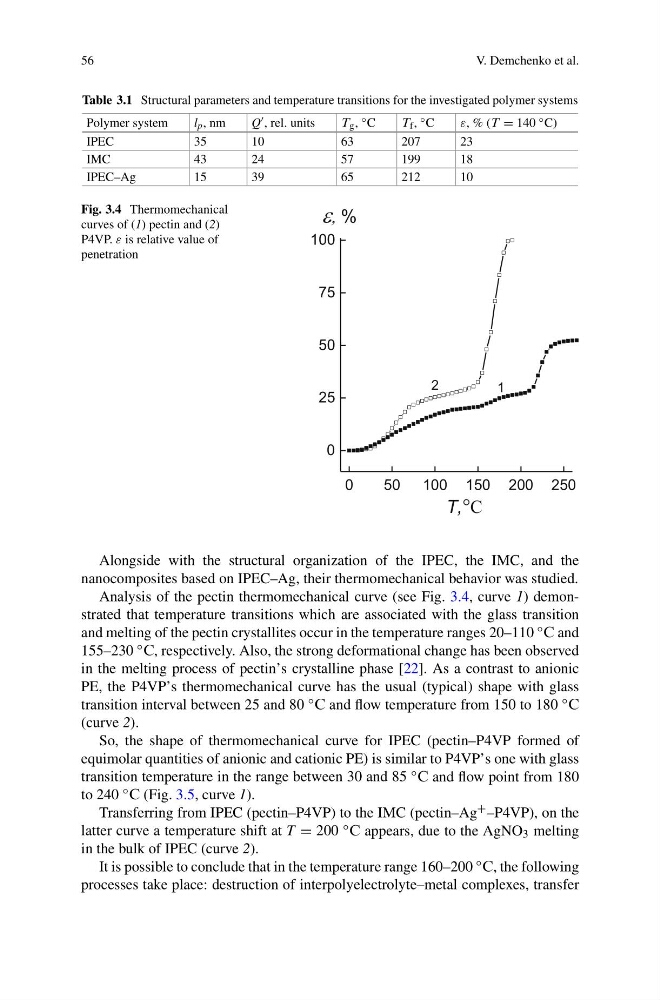
Fig. 3.4 Thermomechanical
curves of (1) pectin and (2)
P4VP. ε is relative value of
penetration
0
50 100 150 200 250
0
25
50
75
100
e, %
T,°С
2
1
Alongside with the structural organization of the IPEC, the IMC, and the
nanocomposites based on IPEC–Ag, their thermomechanical behavior was studied.
Analysis of the pectin thermomechanical curve (see Fig. 3.4, curve 1) demonstrated that temperature transitions which are associated with the glass transition
and melting of the pectin crystallites occur in the temperature ranges 20–110 ◦ ´ and
155–230 ◦ ´, respectively. Also, the strong deformational change has been observed
in the melting process of pectin’s crystalline phase [22]. As a contrast to anionic
PE, the P4VP’s thermomechanical curve has the usual (typical) shape with glass
transition interval between 25 and 80 ◦ ´ and flow temperature from 150 to 180 ◦ ´
(curve 2).
So, the shape of thermomechanical curve for IPEC (pectin–P4VP formed of
equimolar quantities of anionic and cationic PE) is similar to P4VP’s one with glass
transition temperature in the range between 30 and 85 ◦ ´ and flow point from 180
to 240 ◦ ´ (Fig. 3.5, curve 1).
Transferring from IPEC (pectin–P4VP) to the IMC (pectin–Ag + –P4VP), on the
latter curve a temperature shift at T = 200 ◦ ´ appears, due to the AgNO 3 melting
in the bulk of IPEC (curve 2).
It is possible to conclude that in the temperature range 160–200 ◦ ´, the following
processes take place: destruction of interpolyelectrolyte–metal complexes, transfer
V. Demchenko et al.
Table 3.1 Structural parameters and temperature transitions for the investigated polymer systems
Polymer system
l p , nm
Q , rel. units
µ g , ◦ C
µ f , ◦ C
ε, % (µ = 140 ◦ C)
IPEC
35
10
63
207
23
IMC
43
24
57
199
18
IPEC–Ag
15
39
65
212
10
Fig. 3.4 Thermomechanical
curves of (1) pectin and (2)
P4VP. ε is relative value of
penetration
0
50 100 150 200 250
0
25
50
75
100
e, %
T,°С
2
1
Alongside with the structural organization of the IPEC, the IMC, and the
nanocomposites based on IPEC–Ag, their thermomechanical behavior was studied.
Analysis of the pectin thermomechanical curve (see Fig. 3.4, curve 1) demonstrated that temperature transitions which are associated with the glass transition
and melting of the pectin crystallites occur in the temperature ranges 20–110 ◦ ´ and
155–230 ◦ ´, respectively. Also, the strong deformational change has been observed
in the melting process of pectin’s crystalline phase [22]. As a contrast to anionic
PE, the P4VP’s thermomechanical curve has the usual (typical) shape with glass
transition interval between 25 and 80 ◦ ´ and flow temperature from 150 to 180 ◦ ´
(curve 2).
So, the shape of thermomechanical curve for IPEC (pectin–P4VP formed of
equimolar quantities of anionic and cationic PE) is similar to P4VP’s one with glass
transition temperature in the range between 30 and 85 ◦ ´ and flow point from 180
to 240 ◦ ´ (Fig. 3.5, curve 1).
Transferring from IPEC (pectin–P4VP) to the IMC (pectin–Ag + –P4VP), on the
latter curve a temperature shift at T = 200 ◦ ´ appears, due to the AgNO 3 melting
in the bulk of IPEC (curve 2).
It is possible to conclude that in the temperature range 160–200 ◦ ´, the following
processes take place: destruction of interpolyelectrolyte–metal complexes, transfer