

27 Cooperative Phenomena in Spin-Crossover Molecular Crystals
433
(a)
(b)
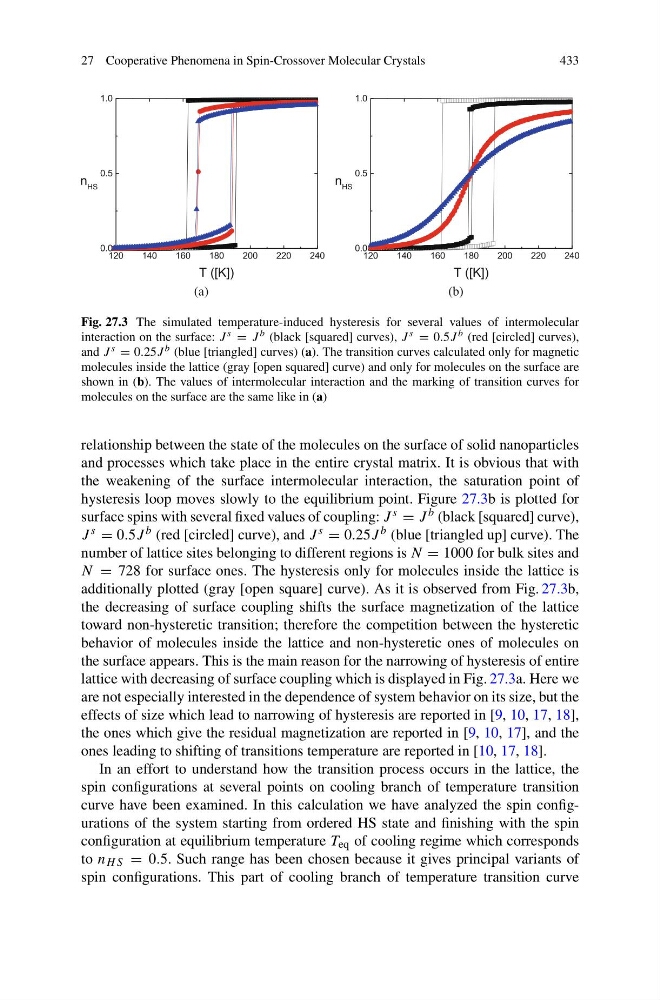
Fig. 27.3 The simulated temperature-induced hysteresis for several values of intermolecular
interaction on the surface: J s = J b (black [squared] curves), J s = 0.5J b (red [circled] curves),
and J s = 0.25J b (blue [triangled] curves) (a). The transition curves calculated only for magnetic
molecules inside the lattice (gray [open squared] curve) and only for molecules on the surface are
shown in (b). The values of intermolecular interaction and the marking of transition curves for
molecules on the surface are the same like in (a)
relationship between the state of the molecules on the surface of solid nanoparticles
and processes which take place in the entire crystal matrix. It is obvious that with
the weakening of the surface intermolecular interaction, the saturation point of
hysteresis loop moves slowly to the equilibrium point. Figure 27.3b is plotted for
surface spins with several fixed values of coupling: J s = J b (black [squared] curve),
J s = 0.5J b (red [circled] curve), and J s = 0.25J b (blue [triangled up] curve). The
number of lattice sites belonging to different regions is N = 1000 for bulk sites and
N = 728 for surface ones. The hysteresis only for molecules inside the lattice is
additionally plotted (gray [open square] curve). As it is observed from Fig. 27.3b,
the decreasing of surface coupling shifts the surface magnetization of the lattice
toward non-hysteretic transition; therefore the competition between the hysteretic
behavior of molecules inside the lattice and non-hysteretic ones of molecules on
the surface appears. This is the main reason for the narrowing of hysteresis of entire
lattice with decreasing of surface coupling which is displayed in Fig. 27.3a. Here we
are not especially interested in the dependence of system behavior on its size, but the
effects of size which lead to narrowing of hysteresis are reported in [9, 10, 17, 18],
the ones which give the residual magnetization are reported in [9, 10, 17], and the
ones leading to shifting of transitions temperature are reported in [10, 17, 18].
In an effort to understand how the transition process occurs in the lattice, the
spin configurations at several points on cooling branch of temperature transition
curve have been examined. In this calculation we have analyzed the spin configurations of the system starting from ordered HS state and finishing with the spin
configuration at equilibrium temperature T eq of cooling regime which corresponds
to n H S = 0.5. Such range has been chosen because it gives principal variants of
spin configurations. This part of cooling branch of temperature transition curve
433
(a)
(b)
Fig. 27.3 The simulated temperature-induced hysteresis for several values of intermolecular
interaction on the surface: J s = J b (black [squared] curves), J s = 0.5J b (red [circled] curves),
and J s = 0.25J b (blue [triangled] curves) (a). The transition curves calculated only for magnetic
molecules inside the lattice (gray [open squared] curve) and only for molecules on the surface are
shown in (b). The values of intermolecular interaction and the marking of transition curves for
molecules on the surface are the same like in (a)
relationship between the state of the molecules on the surface of solid nanoparticles
and processes which take place in the entire crystal matrix. It is obvious that with
the weakening of the surface intermolecular interaction, the saturation point of
hysteresis loop moves slowly to the equilibrium point. Figure 27.3b is plotted for
surface spins with several fixed values of coupling: J s = J b (black [squared] curve),
J s = 0.5J b (red [circled] curve), and J s = 0.25J b (blue [triangled up] curve). The
number of lattice sites belonging to different regions is N = 1000 for bulk sites and
N = 728 for surface ones. The hysteresis only for molecules inside the lattice is
additionally plotted (gray [open square] curve). As it is observed from Fig. 27.3b,
the decreasing of surface coupling shifts the surface magnetization of the lattice
toward non-hysteretic transition; therefore the competition between the hysteretic
behavior of molecules inside the lattice and non-hysteretic ones of molecules on
the surface appears. This is the main reason for the narrowing of hysteresis of entire
lattice with decreasing of surface coupling which is displayed in Fig. 27.3a. Here we
are not especially interested in the dependence of system behavior on its size, but the
effects of size which lead to narrowing of hysteresis are reported in [9, 10, 17, 18],
the ones which give the residual magnetization are reported in [9, 10, 17], and the
ones leading to shifting of transitions temperature are reported in [10, 17, 18].
In an effort to understand how the transition process occurs in the lattice, the
spin configurations at several points on cooling branch of temperature transition
curve have been examined. In this calculation we have analyzed the spin configurations of the system starting from ordered HS state and finishing with the spin
configuration at equilibrium temperature T eq of cooling regime which corresponds
to n H S = 0.5. Such range has been chosen because it gives principal variants of
spin configurations. This part of cooling branch of temperature transition curve