

434
Iu. Gudyma et al.
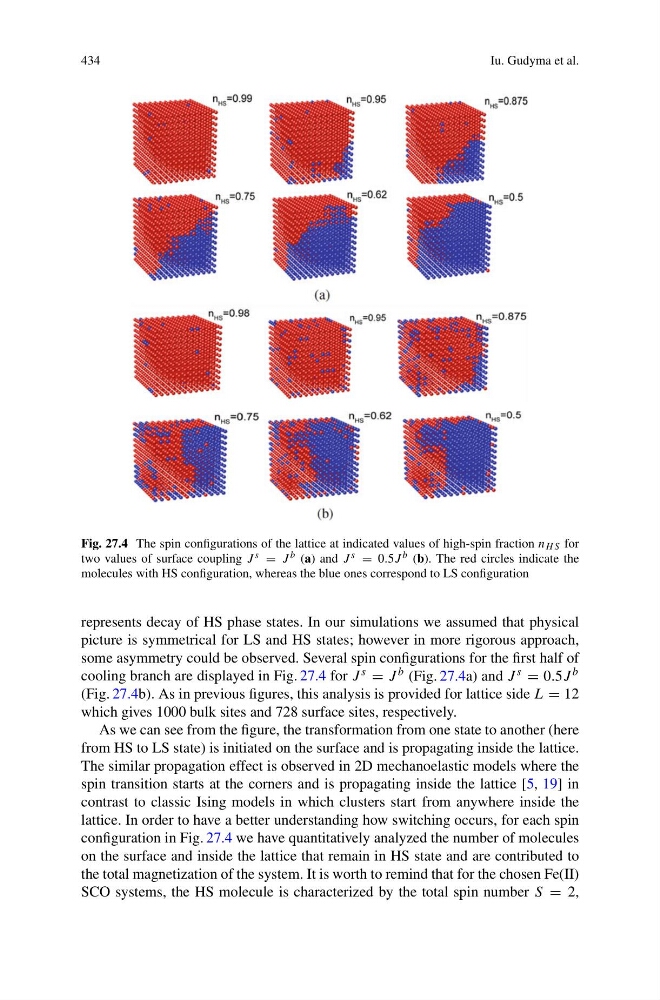
Fig. 27.4 The spin configurations of the lattice at indicated values of high-spin fraction n H S for
two values of surface coupling J s = J b (a) and J s = 0.5J b (b). The red circles indicate the
molecules with HS configuration, whereas the blue ones correspond to LS configuration
represents decay of HS phase states. In our simulations we assumed that physical
picture is symmetrical for LS and HS states; however in more rigorous approach,
some asymmetry could be observed. Several spin configurations for the first half of
cooling branch are displayed in Fig. 27.4 for J s = J b (Fig. 27.4a) and J s = 0.5J b
(Fig. 27.4b). As in previous figures, this analysis is provided for lattice side L = 12
which gives 1000 bulk sites and 728 surface sites, respectively.
As we can see from the figure, the transformation from one state to another (here
from HS to LS state) is initiated on the surface and is propagating inside the lattice.
The similar propagation effect is observed in 2D mechanoelastic models where the
spin transition starts at the corners and is propagating inside the lattice [5, 19] in
contrast to classic Ising models in which clusters start from anywhere inside the
lattice. In order to have a better understanding how switching occurs, for each spin
configuration in Fig. 27.4 we have quantitatively analyzed the number of molecules
on the surface and inside the lattice that remain in HS state and are contributed to
the total magnetization of the system. It is worth to remind that for the chosen Fe(II)
SCO systems, the HS molecule is characterized by the total spin number S = 2,
Iu. Gudyma et al.
Fig. 27.4 The spin configurations of the lattice at indicated values of high-spin fraction n H S for
two values of surface coupling J s = J b (a) and J s = 0.5J b (b). The red circles indicate the
molecules with HS configuration, whereas the blue ones correspond to LS configuration
represents decay of HS phase states. In our simulations we assumed that physical
picture is symmetrical for LS and HS states; however in more rigorous approach,
some asymmetry could be observed. Several spin configurations for the first half of
cooling branch are displayed in Fig. 27.4 for J s = J b (Fig. 27.4a) and J s = 0.5J b
(Fig. 27.4b). As in previous figures, this analysis is provided for lattice side L = 12
which gives 1000 bulk sites and 728 surface sites, respectively.
As we can see from the figure, the transformation from one state to another (here
from HS to LS state) is initiated on the surface and is propagating inside the lattice.
The similar propagation effect is observed in 2D mechanoelastic models where the
spin transition starts at the corners and is propagating inside the lattice [5, 19] in
contrast to classic Ising models in which clusters start from anywhere inside the
lattice. In order to have a better understanding how switching occurs, for each spin
configuration in Fig. 27.4 we have quantitatively analyzed the number of molecules
on the surface and inside the lattice that remain in HS state and are contributed to
the total magnetization of the system. It is worth to remind that for the chosen Fe(II)
SCO systems, the HS molecule is characterized by the total spin number S = 2,