

24 Dielectric Properties and AC Conductivity of Epoxy/Hybrid Nanocarbon. . .
383
The Nyquist diagram exhibits a semicircle for CMs with single GNPs only at
GNP content in 7 wt.%, while in a case of CMs with hybrid filler, GNP/CNT
semicircle dependence Z (Z
) appears for the lower content of carbon filler and
means that conductive pathways have been formed, and there are currents and
polarization among conductors [21]. Such difference in Nyquist diagram behavior
for GNP- and GNP/CNT/L285 composites is explained by lower percolation
threshold for CMs filled with CNTs and CNT content in 1–2 wt.% and is sufficiently
bigger than the C cr for CNT/L285 CMs. Data on σ DC for these composites were
presented in our previous paper [22]. Because of the large aspect ratio, CNTs are
easy to curl and form coil structures and thus producing an inductance. As the
content of CNTs increases, CNTs tend toward aggregate, resulting in increase of
the inductance [23].
In order to obtain more detail information about properties of the developed composites, different circuits are considered for analysis of actual complex impedance
spectra [23, 24]. All composites have microcapacitor structures, and thus a capacitor
exists in their equivalent circuits. In addition, at high content of conductive filler,
equivalent circuit of composite has an inductance. However, it is worth pointing
out that CMs with various content and type of filler have greatly different values of
equivalent circuit elements because of different spatial distribution and dispersion of
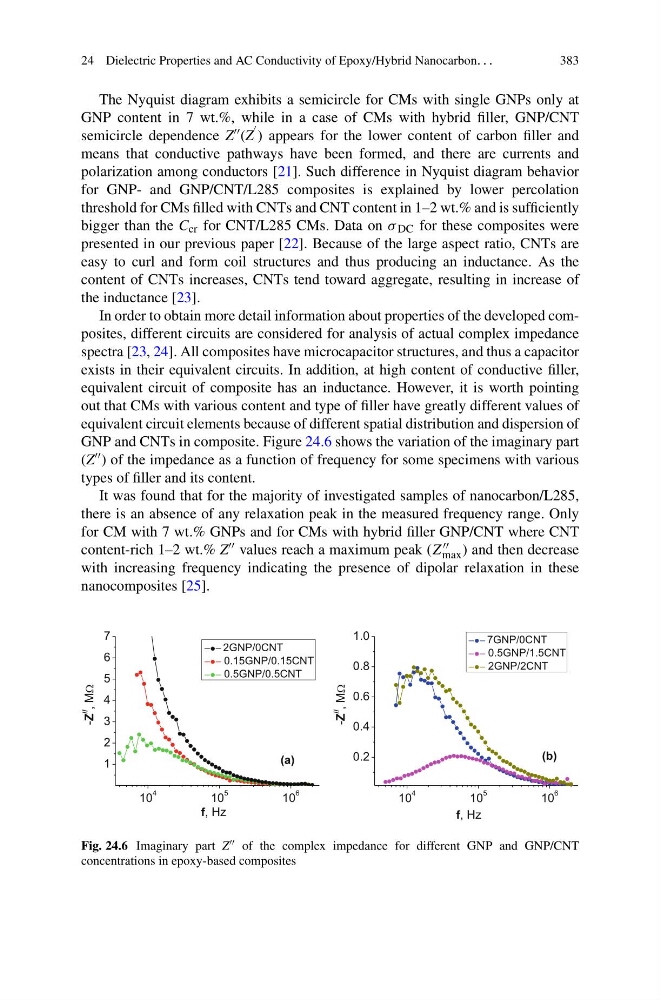
GNP and CNTs in composite. Figure 24.6 shows the variation of the imaginary part
(Z ) of the impedance as a function of frequency for some specimens with various
types of filler and its content.
It was found that for the majority of investigated samples of nanocarbon/L285,
there is an absence of any relaxation peak in the measured frequency range. Only
for CM with 7 wt.% GNPs and for CMs with hybrid filler GNP/CNT where CNT
content-rich 1–2 wt.% Z values reach a maximum peak (Z
max ) and then decrease
with increasing frequency indicating the presence of dipolar relaxation in these
nanocomposites [25].
10
4
10
5
10
6
1
2
3
4
5
6
7
(a)
f, Hz
-Z
//
, MW
2GNP/0CNT
0.15GNP/0.15CNT
0.5GNP/0.5CNT
10
4
10
5
10
6
0.2
0.4
0.6
0.8
1.0
(b)
-Z
//
, MW
f, Hz
7GNP/0CNT
0.5GNP/1.5CNT
2GNP/2CNT
Fig. 24.6 Imaginary part Z of the complex impedance for different GNP and GNP/CNT
concentrations in epoxy-based composites
383
The Nyquist diagram exhibits a semicircle for CMs with single GNPs only at
GNP content in 7 wt.%, while in a case of CMs with hybrid filler, GNP/CNT
semicircle dependence Z (Z
) appears for the lower content of carbon filler and
means that conductive pathways have been formed, and there are currents and
polarization among conductors [21]. Such difference in Nyquist diagram behavior
for GNP- and GNP/CNT/L285 composites is explained by lower percolation
threshold for CMs filled with CNTs and CNT content in 1–2 wt.% and is sufficiently
bigger than the C cr for CNT/L285 CMs. Data on σ DC for these composites were
presented in our previous paper [22]. Because of the large aspect ratio, CNTs are
easy to curl and form coil structures and thus producing an inductance. As the
content of CNTs increases, CNTs tend toward aggregate, resulting in increase of
the inductance [23].
In order to obtain more detail information about properties of the developed composites, different circuits are considered for analysis of actual complex impedance
spectra [23, 24]. All composites have microcapacitor structures, and thus a capacitor
exists in their equivalent circuits. In addition, at high content of conductive filler,
equivalent circuit of composite has an inductance. However, it is worth pointing
out that CMs with various content and type of filler have greatly different values of
equivalent circuit elements because of different spatial distribution and dispersion of
GNP and CNTs in composite. Figure 24.6 shows the variation of the imaginary part
(Z ) of the impedance as a function of frequency for some specimens with various
types of filler and its content.
It was found that for the majority of investigated samples of nanocarbon/L285,
there is an absence of any relaxation peak in the measured frequency range. Only
for CM with 7 wt.% GNPs and for CMs with hybrid filler GNP/CNT where CNT
content-rich 1–2 wt.% Z values reach a maximum peak (Z
max ) and then decrease
with increasing frequency indicating the presence of dipolar relaxation in these
nanocomposites [25].
10
4
10
5
10
6
1
2
3
4
5
6
7
(a)
f, Hz
-Z
//
, MW
2GNP/0CNT
0.15GNP/0.15CNT
0.5GNP/0.5CNT
10
4
10
5
10
6
0.2
0.4
0.6
0.8
1.0
(b)
-Z
//
, MW
f, Hz
7GNP/0CNT
0.5GNP/1.5CNT
2GNP/2CNT
Fig. 24.6 Imaginary part Z of the complex impedance for different GNP and GNP/CNT
concentrations in epoxy-based composites