

382
L. L. Vovchenko et al.
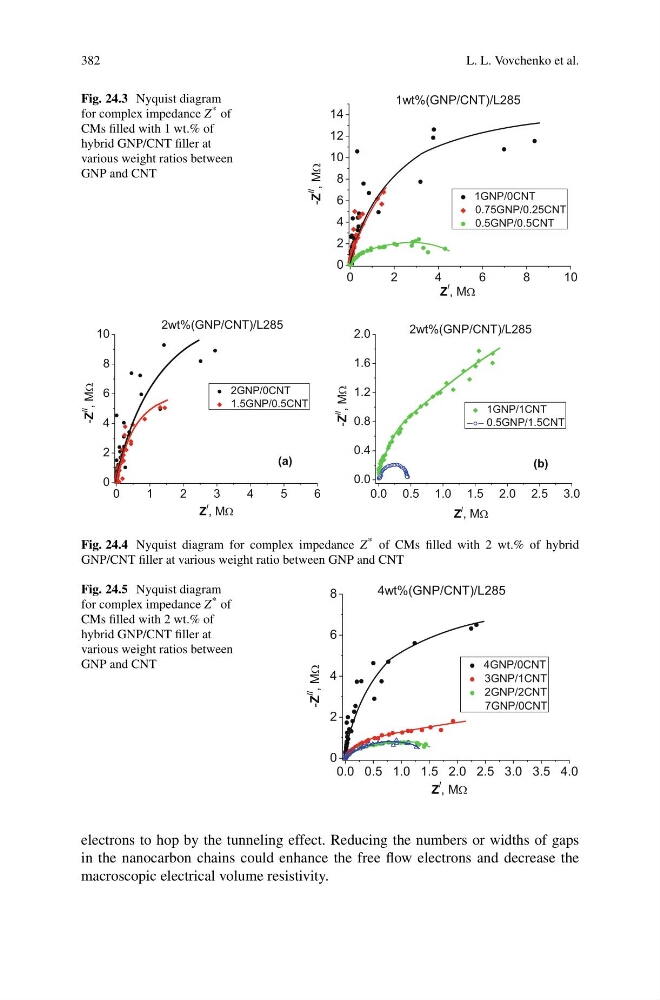
Fig. 24.3 Nyquist diagram
for complex impedance Z * of
CMs filled with 1 wt.% of
hybrid GNP/CNT filler at
various weight ratios between
GNP and CNT
0
2
4
6
8
1 0
0
2
4
6
8
10
12
14
-Z
//
, MW
Z
/
, MW
1wt%(GNP/CNT)/L285
1GNP/0CNT
0.75GNP/0.25CNT
0.5GNP/0.5CNT
0
1
2
3
4
5
6
0
2
4
6
8
10
Z
/
, MW
-Z
//
, MW
2wt%(GNP/CNT)/L285
(a)
2GNP/0CNT
1.5GNP/0.5CNT
0.0 0.5 1.0 1.5 2.0 2.5 3.0
0.0
0.4
0.8
1.2
1.6
2.0
Z
/
, MW
-Z
//
, MW
(b)
2wt%(GNP/CNT)/L285
1GNP/1CNT
0.5GNP/1.5CNT
Fig. 24.4 Nyquist diagram for complex impedance Z * of CMs filled with 2 wt.% of hybrid
GNP/CNT filler at various weight ratio between GNP and CNT
Fig. 24.5 Nyquist diagram
for complex impedance Z * of
CMs filled with 2 wt.% of
hybrid GNP/CNT filler at
various weight ratios between
GNP and CNT
0.0 0.5 1.0 1.5 2.0 2.5 3.0 3.5 4.0
0
2
4
6
8
-Z
//
, MW
Z
/
, MW
4wt%(GNP/CNT)/L285
4GNP/0CNT
3GNP/1CNT
2GNP/2CNT
7GNP/0CNT
electrons to hop by the tunneling effect. Reducing the numbers or widths of gaps
in the nanocarbon chains could enhance the free flow electrons and decrease the
macroscopic electrical volume resistivity.
L. L. Vovchenko et al.
Fig. 24.3 Nyquist diagram
for complex impedance Z * of
CMs filled with 1 wt.% of
hybrid GNP/CNT filler at
various weight ratios between
GNP and CNT
0
2
4
6
8
1 0
0
2
4
6
8
10
12
14
-Z
//
, MW
Z
/
, MW
1wt%(GNP/CNT)/L285
1GNP/0CNT
0.75GNP/0.25CNT
0.5GNP/0.5CNT
0
1
2
3
4
5
6
0
2
4
6
8
10
Z
/
, MW
-Z
//
, MW
2wt%(GNP/CNT)/L285
(a)
2GNP/0CNT
1.5GNP/0.5CNT
0.0 0.5 1.0 1.5 2.0 2.5 3.0
0.0
0.4
0.8
1.2
1.6
2.0
Z
/
, MW
-Z
//
, MW
(b)
2wt%(GNP/CNT)/L285
1GNP/1CNT
0.5GNP/1.5CNT
Fig. 24.4 Nyquist diagram for complex impedance Z * of CMs filled with 2 wt.% of hybrid
GNP/CNT filler at various weight ratio between GNP and CNT
Fig. 24.5 Nyquist diagram
for complex impedance Z * of
CMs filled with 2 wt.% of
hybrid GNP/CNT filler at
various weight ratios between
GNP and CNT
0.0 0.5 1.0 1.5 2.0 2.5 3.0 3.5 4.0
0
2
4
6
8
-Z
//
, MW
Z
/
, MW
4wt%(GNP/CNT)/L285
4GNP/0CNT
3GNP/1CNT
2GNP/2CNT
7GNP/0CNT
electrons to hop by the tunneling effect. Reducing the numbers or widths of gaps
in the nanocarbon chains could enhance the free flow electrons and decrease the
macroscopic electrical volume resistivity.