

23 Ni Addition Induced Changes in Structural, Magnetic, and Cationic. . .
371
Table 23.6 Donor and acceptor active centers on the surface of the Zn 0.75−x Ni x Mg 0.15 Cu 0.1 Fe 2 O 4
system
Ni (Ø) Chemical formulae
Crystalloquasichemical composition
0.00
Zn
2+
0.75 Mg
2+
0.15 Cu
2+
0.10 Fe
3+
2.0 O 24
Zn
×
0.07 Cu
×
0.05 Fe
•
0.88
A
Zn
0.68 Mg
0.15 Cu
0.05 Fe
×
1.12
B
O
×
4
O
0.15
Zn
2+
0.60 Ni
2+
0.15 Mg
2+
0.15 Cu
2+
0.10 Fe
3+
2.0 O 24
Zn
×
0.10 Ni
×
0.15 Fe
•
0.75
A
Zn
0.50 Mg
0.15 Cu
0.10 Fe
×
1.25
B
O
×
4
O
0.30
Zn
2+
0.45 Ni
2+
0.30 Mg
2+
0.15 Cu
2+
0.10 Fe
3+
2.0 O 24
Zn
×
0.06 Ni
×
0.20 Fe
•
0.74
A
Zn
0.39 Ni
0.1 Mg
0.15 Cu
0.10 Fe
×
1.26
B
O
×
4
O
0.45
Zn
2+
0.30 Ni
2+
0.45 Mg
2+
0.15 Cu
2+
0.10 Fe
3+
2.0 O 24
Ni
×
0.33 Fe
•
0.67
A
Zn
0.30 Ni
0.12 Mg
0.15 Cu
0.10 Fe
×
1.33
B
O
×
4
O
0.60
Zn
2+
0.15 Ni
2+
0.60 Mg
2+
0.15 Cu
2+
0.10 Fe
3+
2.0 O 24
Ni
×
0.25 Fe
•
0.75
A
Zn
0.15 Ni
0.35 Mg
0.15 Cu
0.10 Fe
×
1.25
B
O
×
4
O
0.75
Ni
2+
0.75 Mg
2+
0.15 Cu
2+
0.10 Fe
3+
2.0 O 24
Ni
×
0.05 Fe
•
0.95
A
Ni
0.70 Mg
0.15 Cu
0.10 Fe
×
1.05
B
O
×
4
O
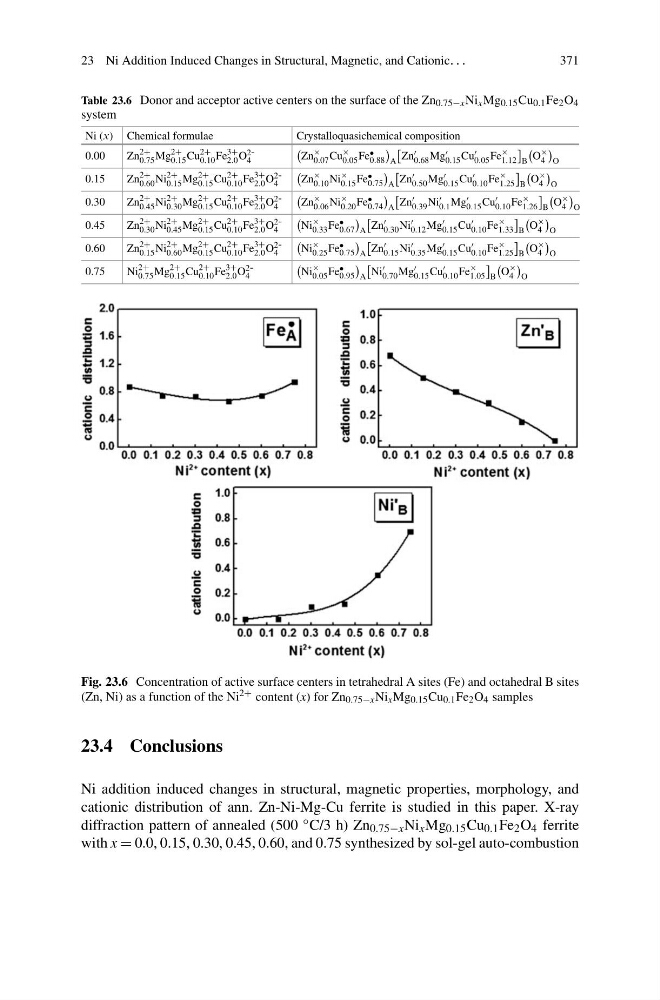
Fig. 23.6 Concentration of active surface centers in tetrahedral A sites (Fe) and octahedral B sites
(Zn, Ni) as a function of the Ni 2+ content (x) for Zn 0.75−x Ni x Mg 0.15 Cu 0.1 Fe 2 O 4 samples
23.4 Conclusions
Ni addition induced changes in structural, magnetic properties, morphology, and
cationic distribution of ann. Zn-Ni-Mg-Cu ferrite is studied in this paper. X-ray
diffraction pattern of annealed (500 ◦ C/3 h) Zn 0.75−x Ni x Mg 0.15 Cu 0.1 Fe 2 O 4 ferrite
with x = 0.0, 0.15, 0.30, 0.45, 0.60, and 0.75 synthesized by sol-gel auto-combustion
371
Table 23.6 Donor and acceptor active centers on the surface of the Zn 0.75−x Ni x Mg 0.15 Cu 0.1 Fe 2 O 4
system
Ni (Ø) Chemical formulae
Crystalloquasichemical composition
0.00
Zn
2+
0.75 Mg
2+
0.15 Cu
2+
0.10 Fe
3+
2.0 O 24
Zn
×
0.07 Cu
×
0.05 Fe
•
0.88
A
Zn
0.68 Mg
0.15 Cu
0.05 Fe
×
1.12
B
O
×
4
O
0.15
Zn
2+
0.60 Ni
2+
0.15 Mg
2+
0.15 Cu
2+
0.10 Fe
3+
2.0 O 24
Zn
×
0.10 Ni
×
0.15 Fe
•
0.75
A
Zn
0.50 Mg
0.15 Cu
0.10 Fe
×
1.25
B
O
×
4
O
0.30
Zn
2+
0.45 Ni
2+
0.30 Mg
2+
0.15 Cu
2+
0.10 Fe
3+
2.0 O 24
Zn
×
0.06 Ni
×
0.20 Fe
•
0.74
A
Zn
0.39 Ni
0.1 Mg
0.15 Cu
0.10 Fe
×
1.26
B
O
×
4
O
0.45
Zn
2+
0.30 Ni
2+
0.45 Mg
2+
0.15 Cu
2+
0.10 Fe
3+
2.0 O 24
Ni
×
0.33 Fe
•
0.67
A
Zn
0.30 Ni
0.12 Mg
0.15 Cu
0.10 Fe
×
1.33
B
O
×
4
O
0.60
Zn
2+
0.15 Ni
2+
0.60 Mg
2+
0.15 Cu
2+
0.10 Fe
3+
2.0 O 24
Ni
×
0.25 Fe
•
0.75
A
Zn
0.15 Ni
0.35 Mg
0.15 Cu
0.10 Fe
×
1.25
B
O
×
4
O
0.75
Ni
2+
0.75 Mg
2+
0.15 Cu
2+
0.10 Fe
3+
2.0 O 24
Ni
×
0.05 Fe
•
0.95
A
Ni
0.70 Mg
0.15 Cu
0.10 Fe
×
1.05
B
O
×
4
O
Fig. 23.6 Concentration of active surface centers in tetrahedral A sites (Fe) and octahedral B sites
(Zn, Ni) as a function of the Ni 2+ content (x) for Zn 0.75−x Ni x Mg 0.15 Cu 0.1 Fe 2 O 4 samples
23.4 Conclusions
Ni addition induced changes in structural, magnetic properties, morphology, and
cationic distribution of ann. Zn-Ni-Mg-Cu ferrite is studied in this paper. X-ray
diffraction pattern of annealed (500 ◦ C/3 h) Zn 0.75−x Ni x Mg 0.15 Cu 0.1 Fe 2 O 4 ferrite
with x = 0.0, 0.15, 0.30, 0.45, 0.60, and 0.75 synthesized by sol-gel auto-combustion