

23 Ni Addition Induced Changes in Structural, Magnetic, and Cationic. . .
365
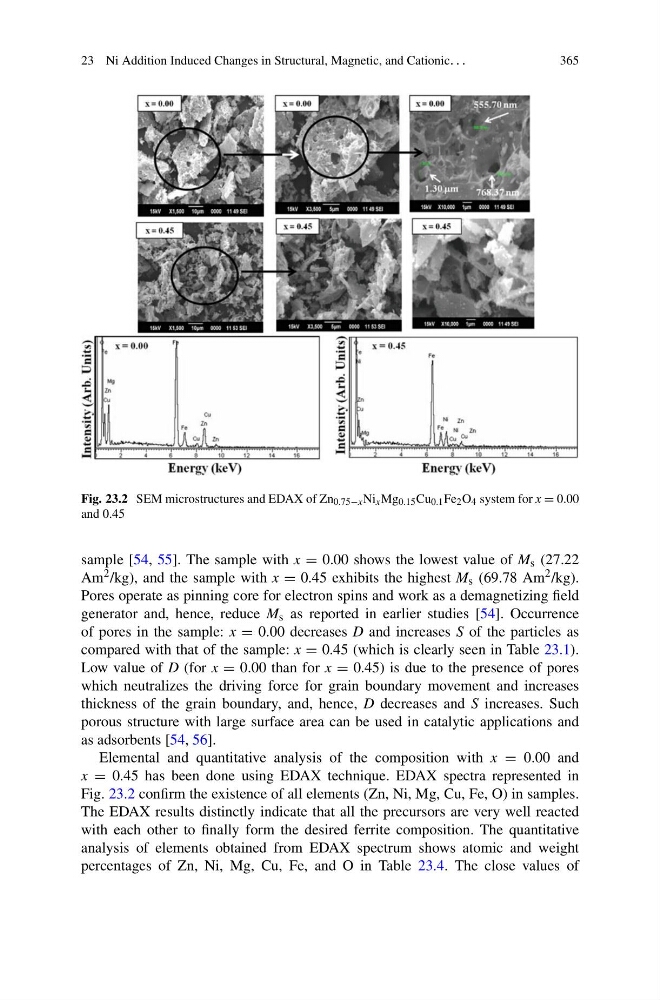
Fig. 23.2 SEM microstructures and EDAX of Zn 0.75−x Ni x Mg 0.15 Cu 0.1 Fe 2 O 4 system for x = 0.00
and 0.45
sample [54, 55]. The sample with x = 0.00 shows the lowest value of M s (27.22
Am 2 /kg), and the sample with x = 0.45 exhibits the highest M s (69.78 Am 2 /kg).
Pores operate as pinning core for electron spins and work as a demagnetizing field
generator and, hence, reduce M s as reported in earlier studies [54]. Occurrence
of pores in the sample: x = 0.00 decreases D and increases S of the particles as
compared with that of the sample: x = 0.45 (which is clearly seen in Table 23.1).
Low value of D (for x = 0.00 than for x = 0.45) is due to the presence of pores
which neutralizes the driving force for grain boundary movement and increases
thickness of the grain boundary, and, hence, D decreases and S increases. Such
porous structure with large surface area can be used in catalytic applications and
as adsorbents [54, 56].
Elemental and quantitative analysis of the composition with x = 0.00 and
x = 0.45 has been done using EDAX technique. EDAX spectra represented in
Fig. 23.2 confirm the existence of all elements (Zn, Ni, Mg, Cu, Fe, O) in samples.
The EDAX results distinctly indicate that all the precursors are very well reacted
with each other to finally form the desired ferrite composition. The quantitative
analysis of elements obtained from EDAX spectrum shows atomic and weight
percentages of Zn, Ni, Mg, Cu, Fe, and O in Table 23.4. The close values of
365
Fig. 23.2 SEM microstructures and EDAX of Zn 0.75−x Ni x Mg 0.15 Cu 0.1 Fe 2 O 4 system for x = 0.00
and 0.45
sample [54, 55]. The sample with x = 0.00 shows the lowest value of M s (27.22
Am 2 /kg), and the sample with x = 0.45 exhibits the highest M s (69.78 Am 2 /kg).
Pores operate as pinning core for electron spins and work as a demagnetizing field
generator and, hence, reduce M s as reported in earlier studies [54]. Occurrence
of pores in the sample: x = 0.00 decreases D and increases S of the particles as
compared with that of the sample: x = 0.45 (which is clearly seen in Table 23.1).
Low value of D (for x = 0.00 than for x = 0.45) is due to the presence of pores
which neutralizes the driving force for grain boundary movement and increases
thickness of the grain boundary, and, hence, D decreases and S increases. Such
porous structure with large surface area can be used in catalytic applications and
as adsorbents [54, 56].
Elemental and quantitative analysis of the composition with x = 0.00 and
x = 0.45 has been done using EDAX technique. EDAX spectra represented in
Fig. 23.2 confirm the existence of all elements (Zn, Ni, Mg, Cu, Fe, O) in samples.
The EDAX results distinctly indicate that all the precursors are very well reacted
with each other to finally form the desired ferrite composition. The quantitative
analysis of elements obtained from EDAX spectrum shows atomic and weight
percentages of Zn, Ni, Mg, Cu, Fe, and O in Table 23.4. The close values of