

23 Ni Addition Induced Changes in Structural, Magnetic, and Cationic. . .
363
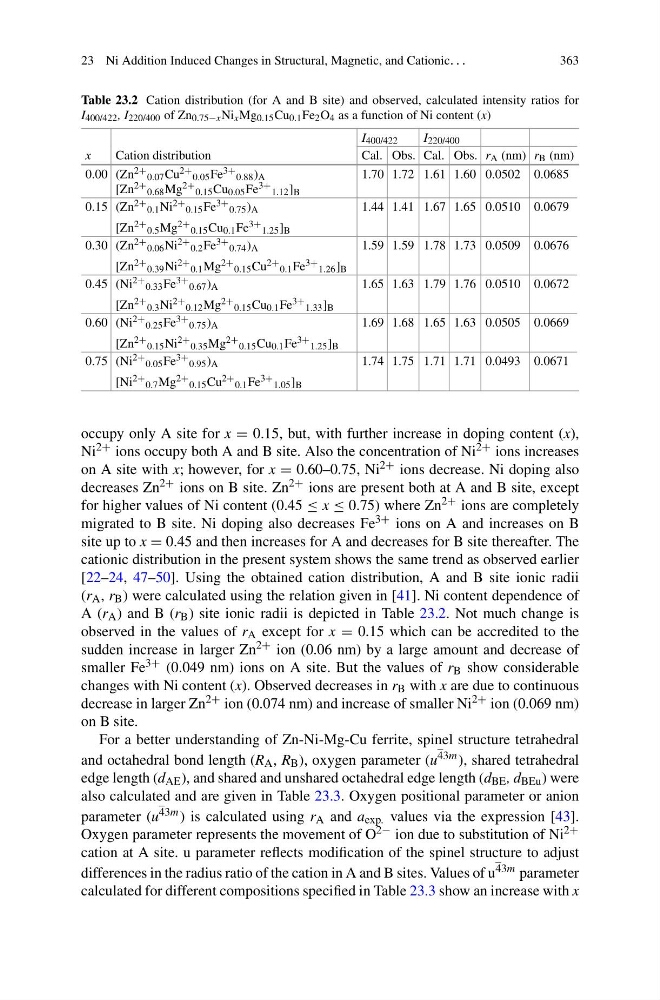
Table 23.2 Cation distribution (for A and B site) and observed, calculated intensity ratios for
I 400/422 , I 220/400 of Zn 0.75−x Ni x Mg 0.15 Cu 0.1 Fe 2 O 4 as a function of Ni content (x)
I 400/422
I 220/400
x
Cation distribution
Cal. Obs. Cal. Obs. r A (nm) r B (nm)
0.00 (Zn 2+ 0.07 Cu 2+ 0.05 Fe 3+ 0.88 ) A
[Zn 2+ 0.68 Mg 2+ 0.15 Cu 0.05 Fe 3+ 1.12 ] B
1.70 1.72 1.61 1.60 0.0502 0.0685
0.15 (Zn 2+ 0.1 Ni 2+ 0.15 Fe 3+ 0.75 ) A
[Zn 2+ 0.5 Mg 2+ 0.15 Cu 0.1 Fe 3+ 1.25 ] B
1.44 1.41 1.67 1.65 0.0510 0.0679
0.30 (Zn 2+ 0.06 Ni 2+ 0.2 Fe 3+ 0.74 ) A
[Zn 2+ 0.39 Ni 2+ 0.1 Mg 2+ 0.15 Cu 2+ 0.1 Fe 3+ 1.26 ] B
1.59 1.59 1.78 1.73 0.0509 0.0676
0.45 (Ni 2+ 0.33 Fe 3+ 0.67 ) A
[Zn 2+ 0.3 Ni 2+ 0.12 Mg 2+ 0.15 Cu 0.1 Fe 3+ 1.33 ] B
1.65 1.63 1.79 1.76 0.0510 0.0672
0.60 (Ni 2+ 0.25 Fe 3+ 0.75 ) A
[Zn 2+ 0.15 Ni 2+ 0.35 Mg 2+ 0.15 Cu 0.1 Fe 3+ 1.25 ] B
1.69 1.68 1.65 1.63 0.0505 0.0669
0.75 (Ni 2+ 0.05 Fe 3+ 0.95 ) A
[Ni 2+ 0.7 Mg 2+ 0.15 Cu 2+ 0.1 Fe 3+ 1.05 ] B
1.74 1.75 1.71 1.71 0.0493 0.0671
occupy only A site for x = 0.15, but, with further increase in doping content (x),
Ni 2+ ions occupy both A and B site. Also the concentration of Ni 2+ ions increases
on A site with x; however, for x = 0.60–0.75, Ni 2+ ions decrease. Ni doping also
decreases Zn 2+ ions on B site. Zn 2+ ions are present both at A and B site, except
for higher values of Ni content (0.45 ≤ x ≤ 0.75) where Zn 2+ ions are completely
migrated to B site. Ni doping also decreases Fe 3+ ions on A and increases on B
site up to x = 0.45 and then increases for A and decreases for B site thereafter. The
cationic distribution in the present system shows the same trend as observed earlier
[22–24, 47–50]. Using the obtained cation distribution, A and B site ionic radii
(r A , r B ) were calculated using the relation given in [41]. Ni content dependence of
A (r A ) and B (r B ) site ionic radii is depicted in Table 23.2. Not much change is
observed in the values of r A except for x = 0.15 which can be accredited to the
sudden increase in larger Zn 2+ ion (0.06 nm) by a large amount and decrease of
smaller Fe 3+ (0.049 nm) ions on A site. But the values of r B show considerable
changes with Ni content (x). Observed decreases in r B with x are due to continuous
decrease in larger Zn 2+ ion (0.074 nm) and increase of smaller Ni 2+ ion (0.069 nm)
on B site.
For a better understanding of Zn-Ni-Mg-Cu ferrite, spinel structure tetrahedral
and octahedral bond length (R A , R B ), oxygen parameter (u 43m ), shared tetrahedral
edge length (d AE ), and shared and unshared octahedral edge length (d BE , d BEu ) were
also calculated and are given in Table 23.3. Oxygen positional parameter or anion
parameter (u 43m ) is calculated using r A and a exp. values via the expression [43].
Oxygen parameter represents the movement of O 2− ion due to substitution of Ni 2+
cation at A site. u parameter reflects modification of the spinel structure to adjust
differences in the radius ratio of the cation in A and B sites. Values of u 43m parameter
calculated for different compositions specified in Table 23.3 show an increase with x
363
Table 23.2 Cation distribution (for A and B site) and observed, calculated intensity ratios for
I 400/422 , I 220/400 of Zn 0.75−x Ni x Mg 0.15 Cu 0.1 Fe 2 O 4 as a function of Ni content (x)
I 400/422
I 220/400
x
Cation distribution
Cal. Obs. Cal. Obs. r A (nm) r B (nm)
0.00 (Zn 2+ 0.07 Cu 2+ 0.05 Fe 3+ 0.88 ) A
[Zn 2+ 0.68 Mg 2+ 0.15 Cu 0.05 Fe 3+ 1.12 ] B
1.70 1.72 1.61 1.60 0.0502 0.0685
0.15 (Zn 2+ 0.1 Ni 2+ 0.15 Fe 3+ 0.75 ) A
[Zn 2+ 0.5 Mg 2+ 0.15 Cu 0.1 Fe 3+ 1.25 ] B
1.44 1.41 1.67 1.65 0.0510 0.0679
0.30 (Zn 2+ 0.06 Ni 2+ 0.2 Fe 3+ 0.74 ) A
[Zn 2+ 0.39 Ni 2+ 0.1 Mg 2+ 0.15 Cu 2+ 0.1 Fe 3+ 1.26 ] B
1.59 1.59 1.78 1.73 0.0509 0.0676
0.45 (Ni 2+ 0.33 Fe 3+ 0.67 ) A
[Zn 2+ 0.3 Ni 2+ 0.12 Mg 2+ 0.15 Cu 0.1 Fe 3+ 1.33 ] B
1.65 1.63 1.79 1.76 0.0510 0.0672
0.60 (Ni 2+ 0.25 Fe 3+ 0.75 ) A
[Zn 2+ 0.15 Ni 2+ 0.35 Mg 2+ 0.15 Cu 0.1 Fe 3+ 1.25 ] B
1.69 1.68 1.65 1.63 0.0505 0.0669
0.75 (Ni 2+ 0.05 Fe 3+ 0.95 ) A
[Ni 2+ 0.7 Mg 2+ 0.15 Cu 2+ 0.1 Fe 3+ 1.05 ] B
1.74 1.75 1.71 1.71 0.0493 0.0671
occupy only A site for x = 0.15, but, with further increase in doping content (x),
Ni 2+ ions occupy both A and B site. Also the concentration of Ni 2+ ions increases
on A site with x; however, for x = 0.60–0.75, Ni 2+ ions decrease. Ni doping also
decreases Zn 2+ ions on B site. Zn 2+ ions are present both at A and B site, except
for higher values of Ni content (0.45 ≤ x ≤ 0.75) where Zn 2+ ions are completely
migrated to B site. Ni doping also decreases Fe 3+ ions on A and increases on B
site up to x = 0.45 and then increases for A and decreases for B site thereafter. The
cationic distribution in the present system shows the same trend as observed earlier
[22–24, 47–50]. Using the obtained cation distribution, A and B site ionic radii
(r A , r B ) were calculated using the relation given in [41]. Ni content dependence of
A (r A ) and B (r B ) site ionic radii is depicted in Table 23.2. Not much change is
observed in the values of r A except for x = 0.15 which can be accredited to the
sudden increase in larger Zn 2+ ion (0.06 nm) by a large amount and decrease of
smaller Fe 3+ (0.049 nm) ions on A site. But the values of r B show considerable
changes with Ni content (x). Observed decreases in r B with x are due to continuous
decrease in larger Zn 2+ ion (0.074 nm) and increase of smaller Ni 2+ ion (0.069 nm)
on B site.
For a better understanding of Zn-Ni-Mg-Cu ferrite, spinel structure tetrahedral
and octahedral bond length (R A , R B ), oxygen parameter (u 43m ), shared tetrahedral
edge length (d AE ), and shared and unshared octahedral edge length (d BE , d BEu ) were
also calculated and are given in Table 23.3. Oxygen positional parameter or anion
parameter (u 43m ) is calculated using r A and a exp. values via the expression [43].
Oxygen parameter represents the movement of O 2− ion due to substitution of Ni 2+
cation at A site. u parameter reflects modification of the spinel structure to adjust
differences in the radius ratio of the cation in A and B sites. Values of u 43m parameter
calculated for different compositions specified in Table 23.3 show an increase with x