

362
M. Satalkar et al.
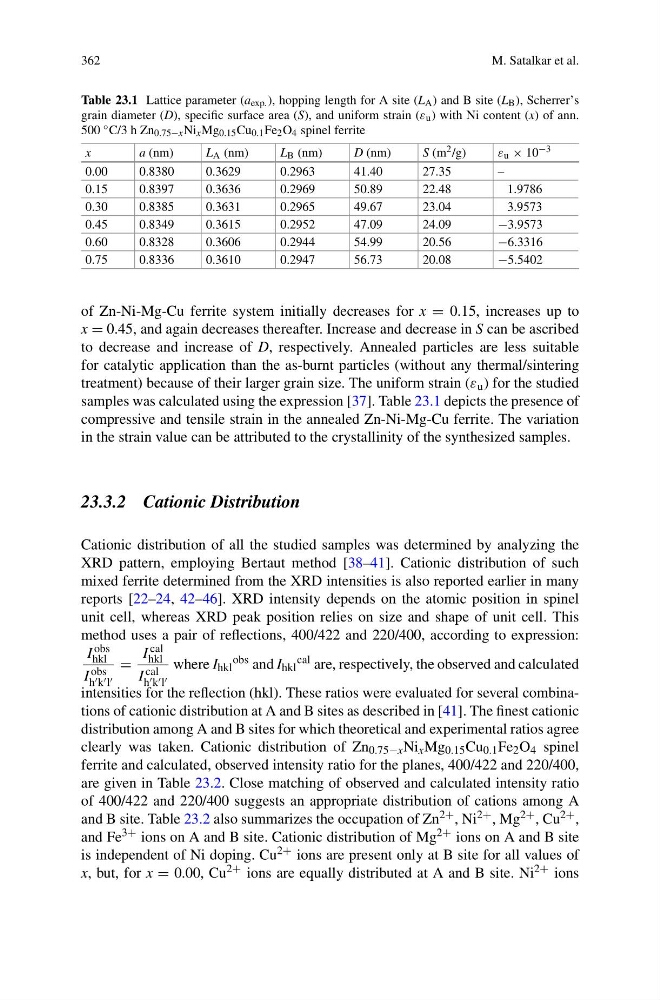
Table 23.1 Lattice parameter (a exp. ), hopping length for A site (L A ) and B site (L B ), Scherrer’s
grain diameter (D), specific surface area (S), and uniform strain (ε u ) with Ni content (x) of ann.
500 ◦ C/3 h Zn 0.75−x Ni x Mg 0.15 Cu 0.1 Fe 2 O 4 spinel ferrite
x
a (nm)
L A (nm)
L B (nm)
D (nm)
S (m 2 /g)
ε u × 10 −3
0.00
0.8380
0.3629
0.2963
41.40
27.35
–
0.15
0.8397
0.3636
0.2969
50.89
22.48
1.9786
0.30
0.8385
0.3631
0.2965
49.67
23.04
3.9573
0.45
0.8349
0.3615
0.2952
47.09
24.09
−3.9573
0.60
0.8328
0.3606
0.2944
54.99
20.56
−6.3316
0.75
0.8336
0.3610
0.2947
56.73
20.08
−5.5402
of Zn-Ni-Mg-Cu ferrite system initially decreases for x = 0.15, increases up to
x = 0.45, and again decreases thereafter. Increase and decrease in S can be ascribed
to decrease and increase of D, respectively. Annealed particles are less suitable
for catalytic application than the as-burnt particles (without any thermal/sintering
treatment) because of their larger grain size. The uniform strain (ε u ) for the studied
samples was calculated using the expression [37]. Table 23.1 depicts the presence of
compressive and tensile strain in the annealed Zn-Ni-Mg-Cu ferrite. The variation
in the strain value can be attributed to the crystallinity of the synthesized samples.
23.3.2 Cationic Distribution
Cationic distribution of all the studied samples was determined by analyzing the
XRD pattern, employing Bertaut method [38–41]. Cationic distribution of such
mixed ferrite determined from the XRD intensities is also reported earlier in many
reports [22–24, 42–46]. XRD intensity depends on the atomic position in spinel
unit cell, whereas XRD peak position relies on size and shape of unit cell. This
method uses a pair of reflections, 400/422 and 220/400, according to expression:
I obs
hkl
I obs
h k l
=
I cal
hkl
I cal
h k l
where I hkl
obs and I hkl
cal are, respectively, the observed and calculated
intensities for the reflection (hkl). These ratios were evaluated for several combinations of cationic distribution at A and B sites as described in [41]. The finest cationic
distribution among A and B sites for which theoretical and experimental ratios agree
clearly was taken. Cationic distribution of Zn 0.75−x Ni x Mg 0.15 Cu 0.1 Fe 2 O 4 spinel
ferrite and calculated, observed intensity ratio for the planes, 400/422 and 220/400,
are given in Table 23.2. Close matching of observed and calculated intensity ratio
of 400/422 and 220/400 suggests an appropriate distribution of cations among A
and B site. Table 23.2 also summarizes the occupation of Zn 2+ , Ni 2+ , Mg 2+ , Cu 2+ ,
and Fe 3+ ions on A and B site. Cationic distribution of Mg 2+ ions on A and B site
is independent of Ni doping. Cu 2+ ions are present only at B site for all values of
x, but, for x = 0.00, Cu 2+ ions are equally distributed at A and B site. Ni 2+ ions
M. Satalkar et al.
Table 23.1 Lattice parameter (a exp. ), hopping length for A site (L A ) and B site (L B ), Scherrer’s
grain diameter (D), specific surface area (S), and uniform strain (ε u ) with Ni content (x) of ann.
500 ◦ C/3 h Zn 0.75−x Ni x Mg 0.15 Cu 0.1 Fe 2 O 4 spinel ferrite
x
a (nm)
L A (nm)
L B (nm)
D (nm)
S (m 2 /g)
ε u × 10 −3
0.00
0.8380
0.3629
0.2963
41.40
27.35
–
0.15
0.8397
0.3636
0.2969
50.89
22.48
1.9786
0.30
0.8385
0.3631
0.2965
49.67
23.04
3.9573
0.45
0.8349
0.3615
0.2952
47.09
24.09
−3.9573
0.60
0.8328
0.3606
0.2944
54.99
20.56
−6.3316
0.75
0.8336
0.3610
0.2947
56.73
20.08
−5.5402
of Zn-Ni-Mg-Cu ferrite system initially decreases for x = 0.15, increases up to
x = 0.45, and again decreases thereafter. Increase and decrease in S can be ascribed
to decrease and increase of D, respectively. Annealed particles are less suitable
for catalytic application than the as-burnt particles (without any thermal/sintering
treatment) because of their larger grain size. The uniform strain (ε u ) for the studied
samples was calculated using the expression [37]. Table 23.1 depicts the presence of
compressive and tensile strain in the annealed Zn-Ni-Mg-Cu ferrite. The variation
in the strain value can be attributed to the crystallinity of the synthesized samples.
23.3.2 Cationic Distribution
Cationic distribution of all the studied samples was determined by analyzing the
XRD pattern, employing Bertaut method [38–41]. Cationic distribution of such
mixed ferrite determined from the XRD intensities is also reported earlier in many
reports [22–24, 42–46]. XRD intensity depends on the atomic position in spinel
unit cell, whereas XRD peak position relies on size and shape of unit cell. This
method uses a pair of reflections, 400/422 and 220/400, according to expression:
I obs
hkl
I obs
h k l
=
I cal
hkl
I cal
h k l
where I hkl
obs and I hkl
cal are, respectively, the observed and calculated
intensities for the reflection (hkl). These ratios were evaluated for several combinations of cationic distribution at A and B sites as described in [41]. The finest cationic
distribution among A and B sites for which theoretical and experimental ratios agree
clearly was taken. Cationic distribution of Zn 0.75−x Ni x Mg 0.15 Cu 0.1 Fe 2 O 4 spinel
ferrite and calculated, observed intensity ratio for the planes, 400/422 and 220/400,
are given in Table 23.2. Close matching of observed and calculated intensity ratio
of 400/422 and 220/400 suggests an appropriate distribution of cations among A
and B site. Table 23.2 also summarizes the occupation of Zn 2+ , Ni 2+ , Mg 2+ , Cu 2+ ,
and Fe 3+ ions on A and B site. Cationic distribution of Mg 2+ ions on A and B site
is independent of Ni doping. Cu 2+ ions are present only at B site for all values of
x, but, for x = 0.00, Cu 2+ ions are equally distributed at A and B site. Ni 2+ ions