

18 The Ultrasonic Treatment as a Promising Method of Nanosized Oxide. . .
307
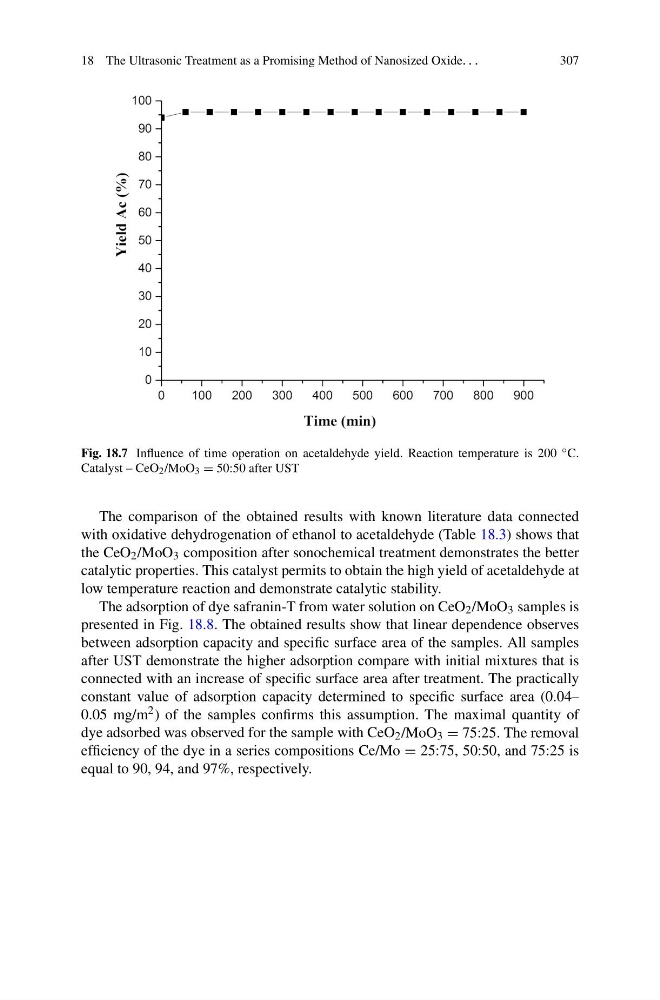
Fig. 18.7 Influence of time operation on acetaldehyde yield. Reaction temperature is 200 ◦ C.
Catalyst – CeO 2 /MoO 3 = 50:50 after UST
The comparison of the obtained results with known literature data connected
with oxidative dehydrogenation of ethanol to acetaldehyde (Table 18.3) shows that
the CeO 2 /MoO 3 composition after sonochemical treatment demonstrates the better
catalytic properties. This catalyst permits to obtain the high yield of acetaldehyde at
low temperature reaction and demonstrate catalytic stability.
The adsorption of dye safranin-T from water solution on CeO 2 /MoO 3 samples is
presented in Fig. 18.8. The obtained results show that linear dependence observes
between adsorption capacity and specific surface area of the samples. All samples
after UST demonstrate the higher adsorption compare with initial mixtures that is
connected with an increase of specific surface area after treatment. The practically
constant value of adsorption capacity determined to specific surface area (0.04–
0.05 mg/m 2 ) of the samples confirms this assumption. The maximal quantity of
dye adsorbed was observed for the sample with CeO 2 /MoO 3 = 75:25. The removal
efficiency of the dye in a series compositions Ce/Mo = 25:75, 50:50, and 75:25 is
equal to 90, 94, and 97%, respectively.
307
Fig. 18.7 Influence of time operation on acetaldehyde yield. Reaction temperature is 200 ◦ C.
Catalyst – CeO 2 /MoO 3 = 50:50 after UST
The comparison of the obtained results with known literature data connected
with oxidative dehydrogenation of ethanol to acetaldehyde (Table 18.3) shows that
the CeO 2 /MoO 3 composition after sonochemical treatment demonstrates the better
catalytic properties. This catalyst permits to obtain the high yield of acetaldehyde at
low temperature reaction and demonstrate catalytic stability.
The adsorption of dye safranin-T from water solution on CeO 2 /MoO 3 samples is
presented in Fig. 18.8. The obtained results show that linear dependence observes
between adsorption capacity and specific surface area of the samples. All samples
after UST demonstrate the higher adsorption compare with initial mixtures that is
connected with an increase of specific surface area after treatment. The practically
constant value of adsorption capacity determined to specific surface area (0.04–
0.05 mg/m 2 ) of the samples confirms this assumption. The maximal quantity of
dye adsorbed was observed for the sample with CeO 2 /MoO 3 = 75:25. The removal
efficiency of the dye in a series compositions Ce/Mo = 25:75, 50:50, and 75:25 is
equal to 90, 94, and 97%, respectively.