

306
V. A. Zazhigalov et al.
Table 18.3 Comparison of the catalysts properties in the gas-phase oxidation of ethanol to
acetaldehyde
№ Catalysts
µ, ◦ ´ ¸ ¨tOH , % S £Ô , % Y £Ô , % References
1
Silver grid (industrial catalyst) 500
70
97
68
[10]
2
Mo-oxide/TiO 2
200
85
90
77
[7]
3
CeO 2
350
44
82
36
[11]
4
Ce/Mo–Sn–O
180
95
70
66
[9]
5
´ÈO 2 /MoO 3 = 50:50, initial
300
100
92
92
This paper
6
´ÈO 2 /MoO 3 = 50:50, UST
200
100
96
96
This paper
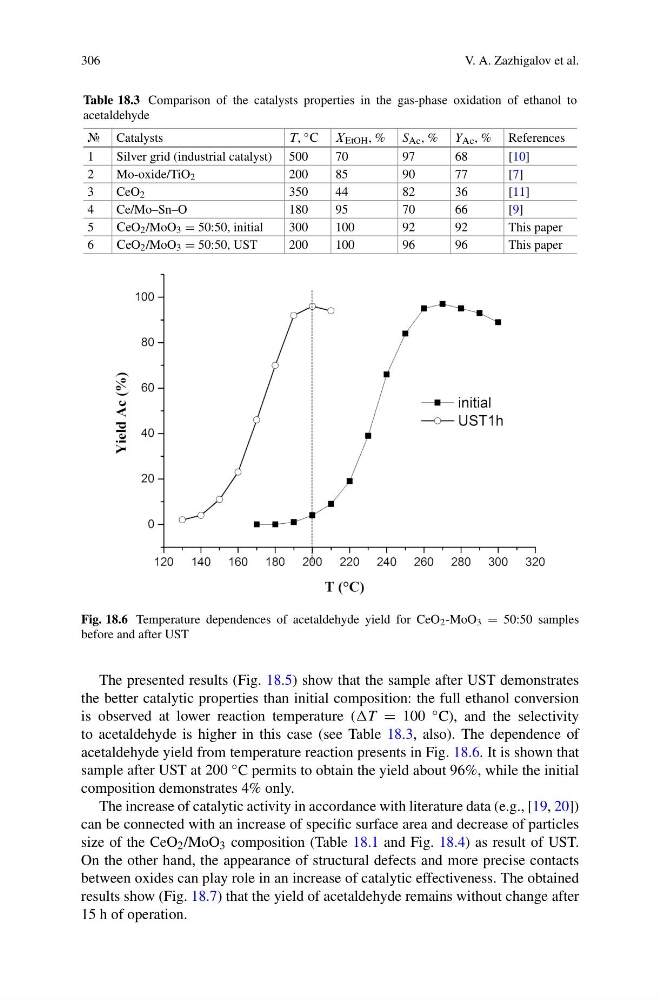
Fig. 18.6 Temperature dependences of acetaldehyde yield for CeO 2 -MoO 3 = 50:50 samples
before and after UST
The presented results (Fig. 18.5) show that the sample after UST demonstrates
the better catalytic properties than initial composition: the full ethanol conversion
is observed at lower reaction temperature (T = 100 ◦ C), and the selectivity
to acetaldehyde is higher in this case (see Table 18.3, also). The dependence of
acetaldehyde yield from temperature reaction presents in Fig. 18.6. It is shown that
sample after UST at 200 ◦ C permits to obtain the yield about 96%, while the initial
composition demonstrates 4% only.
The increase of catalytic activity in accordance with literature data (e.g., [19, 20])
can be connected with an increase of specific surface area and decrease of particles
size of the CeO 2 /MoO 3 composition (Table 18.1 and Fig. 18.4) as result of UST.
On the other hand, the appearance of structural defects and more precise contacts
between oxides can play role in an increase of catalytic effectiveness. The obtained
results show (Fig. 18.7) that the yield of acetaldehyde remains without change after
15 h of operation.
V. A. Zazhigalov et al.
Table 18.3 Comparison of the catalysts properties in the gas-phase oxidation of ethanol to
acetaldehyde
№ Catalysts
µ, ◦ ´ ¸ ¨tOH , % S £Ô , % Y £Ô , % References
1
Silver grid (industrial catalyst) 500
70
97
68
[10]
2
Mo-oxide/TiO 2
200
85
90
77
[7]
3
CeO 2
350
44
82
36
[11]
4
Ce/Mo–Sn–O
180
95
70
66
[9]
5
´ÈO 2 /MoO 3 = 50:50, initial
300
100
92
92
This paper
6
´ÈO 2 /MoO 3 = 50:50, UST
200
100
96
96
This paper
Fig. 18.6 Temperature dependences of acetaldehyde yield for CeO 2 -MoO 3 = 50:50 samples
before and after UST
The presented results (Fig. 18.5) show that the sample after UST demonstrates
the better catalytic properties than initial composition: the full ethanol conversion
is observed at lower reaction temperature (T = 100 ◦ C), and the selectivity
to acetaldehyde is higher in this case (see Table 18.3, also). The dependence of
acetaldehyde yield from temperature reaction presents in Fig. 18.6. It is shown that
sample after UST at 200 ◦ C permits to obtain the yield about 96%, while the initial
composition demonstrates 4% only.
The increase of catalytic activity in accordance with literature data (e.g., [19, 20])
can be connected with an increase of specific surface area and decrease of particles
size of the CeO 2 /MoO 3 composition (Table 18.1 and Fig. 18.4) as result of UST.
On the other hand, the appearance of structural defects and more precise contacts
between oxides can play role in an increase of catalytic effectiveness. The obtained
results show (Fig. 18.7) that the yield of acetaldehyde remains without change after
15 h of operation.