

18 The Ultrasonic Treatment as a Promising Method of Nanosized Oxide. . .
303
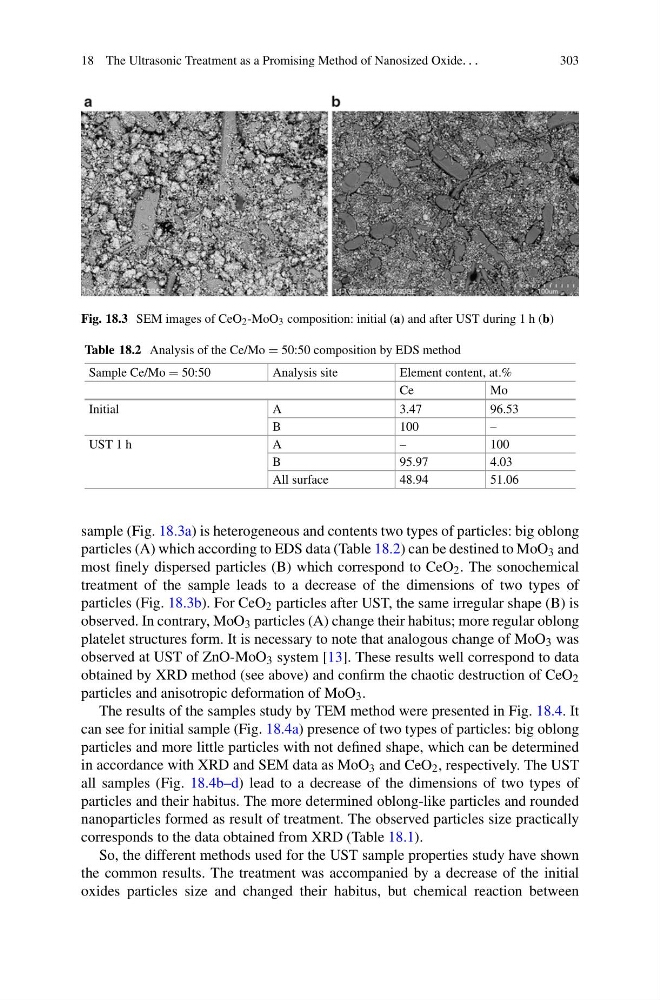
Fig. 18.3 SEM images of CeO 2 -MoO 3 composition: initial (a) and after UST during 1 h (b)
Table 18.2 Analysis of the Ce/Mo = 50:50 composition by EDS method
Sample Ce/Mo = 50:50
Analysis site
Element content, at.%
Ce
Mo
Initial
A
3.47
96.53
B
100
–
UST 1 h
A
–
100
B
95.97
4.03
All surface
48.94
51.06
sample (Fig. 18.3a) is heterogeneous and contents two types of particles: big oblong
particles (A) which according to EDS data (Table 18.2) can be destined to MoO 3 and
most finely dispersed particles (B) which correspond to CeO 2 . The sonochemical
treatment of the sample leads to a decrease of the dimensions of two types of
particles (Fig. 18.3b). For CeO 2 particles after UST, the same irregular shape (B) is
observed. In contrary, MoO 3 particles (A) change their habitus; more regular oblong
platelet structures form. It is necessary to note that analogous change of MoO 3 was
observed at UST of ZnO-MoO 3 system [13]. These results well correspond to data
obtained by XRD method (see above) and confirm the chaotic destruction of CeO 2
particles and anisotropic deformation of MoO 3 .
The results of the samples study by TEM method were presented in Fig. 18.4. It
can see for initial sample (Fig. 18.4a) presence of two types of particles: big oblong
particles and more little particles with not defined shape, which can be determined
in accordance with XRD and SEM data as MoO 3 and CeO 2 , respectively. The UST
all samples (Fig. 18.4b–d) lead to a decrease of the dimensions of two types of
particles and their habitus. The more determined oblong-like particles and rounded
nanoparticles formed as result of treatment. The observed particles size practically
corresponds to the data obtained from XRD (Table 18.1).
So, the different methods used for the UST sample properties study have shown
the common results. The treatment was accompanied by a decrease of the initial
oxides particles size and changed their habitus, but chemical reaction between
303
Fig. 18.3 SEM images of CeO 2 -MoO 3 composition: initial (a) and after UST during 1 h (b)
Table 18.2 Analysis of the Ce/Mo = 50:50 composition by EDS method
Sample Ce/Mo = 50:50
Analysis site
Element content, at.%
Ce
Mo
Initial
A
3.47
96.53
B
100
–
UST 1 h
A
–
100
B
95.97
4.03
All surface
48.94
51.06
sample (Fig. 18.3a) is heterogeneous and contents two types of particles: big oblong
particles (A) which according to EDS data (Table 18.2) can be destined to MoO 3 and
most finely dispersed particles (B) which correspond to CeO 2 . The sonochemical
treatment of the sample leads to a decrease of the dimensions of two types of
particles (Fig. 18.3b). For CeO 2 particles after UST, the same irregular shape (B) is
observed. In contrary, MoO 3 particles (A) change their habitus; more regular oblong
platelet structures form. It is necessary to note that analogous change of MoO 3 was
observed at UST of ZnO-MoO 3 system [13]. These results well correspond to data
obtained by XRD method (see above) and confirm the chaotic destruction of CeO 2
particles and anisotropic deformation of MoO 3 .
The results of the samples study by TEM method were presented in Fig. 18.4. It
can see for initial sample (Fig. 18.4a) presence of two types of particles: big oblong
particles and more little particles with not defined shape, which can be determined
in accordance with XRD and SEM data as MoO 3 and CeO 2 , respectively. The UST
all samples (Fig. 18.4b–d) lead to a decrease of the dimensions of two types of
particles and their habitus. The more determined oblong-like particles and rounded
nanoparticles formed as result of treatment. The observed particles size practically
corresponds to the data obtained from XRD (Table 18.1).
So, the different methods used for the UST sample properties study have shown
the common results. The treatment was accompanied by a decrease of the initial
oxides particles size and changed their habitus, but chemical reaction between