

302
V. A. Zazhigalov et al.
Table 18.1 Particles size of MoO 3 (XRD) and specific surface area (SSA) of ´ÈO 2 -¯Ñ± 3
samples
Parameters
State of the sample
Molecular ratio CeO 2 /MoO 3
15:85
25:75
50:50
75:25
L α-MoO 3 , 020/040, nm
Initial
95/62
90/61
93/61
96/60
a.t. a
78/60
69/65
70/66
77/58
S B¨µ , m 2 /g
Initial
1.5
1.5
1.7
2.0
a.t.
3.2
3.6
5.5
6.6
a a.t. after treatment
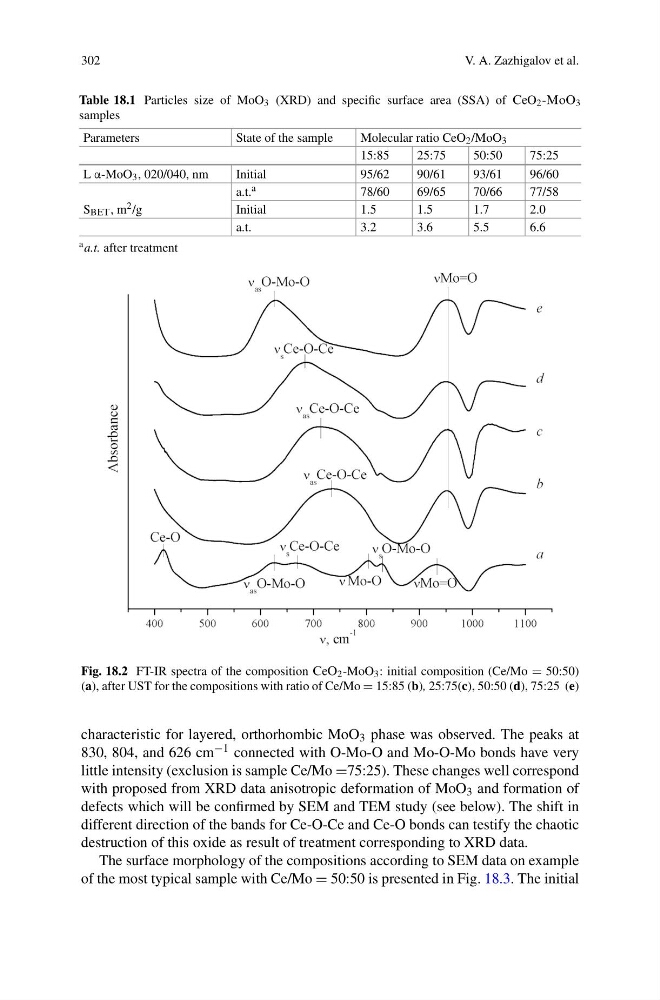
Fig. 18.2 FT-IR spectra of the composition ´È± 2 -MoO 3 : initial composition (Ce/Mo = 50:50)
(a), after UST for the compositions with ratio of Ce/Mo = 15:85 (b), 25:75(c), 50:50 (d), 75:25 (e)
characteristic for layered, orthorhombic MoO 3 phase was observed. The peaks at
830, 804, and 626 cm −1 connected with O-Mo-O and Mo-O-Mo bonds have very
little intensity (exclusion is sample Ce/Mo =75:25). These changes well correspond
with proposed from XRD data anisotropic deformation of MoO 3 and formation of
defects which will be confirmed by SEM and TEM study (see below). The shift in
different direction of the bands for Ce-O-Ce and Ce-O bonds can testify the chaotic
destruction of this oxide as result of treatment corresponding to XRD data.
The surface morphology of the compositions according to SEM data on example
of the most typical sample with Ce/Mo = 50:50 is presented in Fig. 18.3. The initial
V. A. Zazhigalov et al.
Table 18.1 Particles size of MoO 3 (XRD) and specific surface area (SSA) of ´ÈO 2 -¯Ñ± 3
samples
Parameters
State of the sample
Molecular ratio CeO 2 /MoO 3
15:85
25:75
50:50
75:25
L α-MoO 3 , 020/040, nm
Initial
95/62
90/61
93/61
96/60
a.t. a
78/60
69/65
70/66
77/58
S B¨µ , m 2 /g
Initial
1.5
1.5
1.7
2.0
a.t.
3.2
3.6
5.5
6.6
a a.t. after treatment
Fig. 18.2 FT-IR spectra of the composition ´È± 2 -MoO 3 : initial composition (Ce/Mo = 50:50)
(a), after UST for the compositions with ratio of Ce/Mo = 15:85 (b), 25:75(c), 50:50 (d), 75:25 (e)
characteristic for layered, orthorhombic MoO 3 phase was observed. The peaks at
830, 804, and 626 cm −1 connected with O-Mo-O and Mo-O-Mo bonds have very
little intensity (exclusion is sample Ce/Mo =75:25). These changes well correspond
with proposed from XRD data anisotropic deformation of MoO 3 and formation of
defects which will be confirmed by SEM and TEM study (see below). The shift in
different direction of the bands for Ce-O-Ce and Ce-O bonds can testify the chaotic
destruction of this oxide as result of treatment corresponding to XRD data.
The surface morphology of the compositions according to SEM data on example
of the most typical sample with Ce/Mo = 50:50 is presented in Fig. 18.3. The initial