

18 The Ultrasonic Treatment as a Promising Method of Nanosized Oxide. . .
301
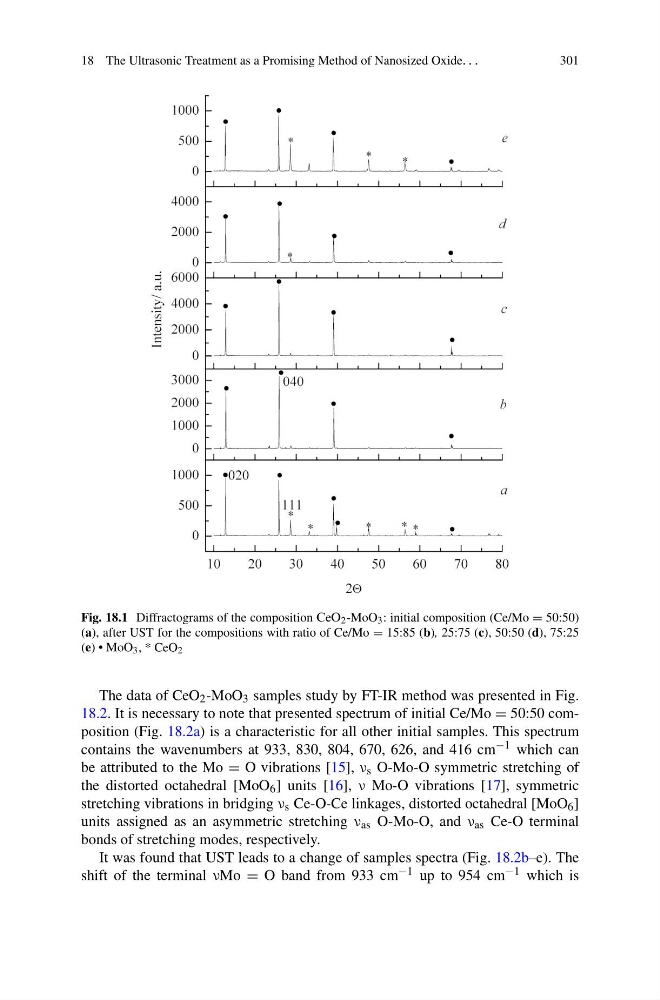
Fig. 18.1 Diffractograms of the composition ´È± 2 -MoO 3 : initial composition (Ce/Mo = 50:50)
(a), after UST for the compositions with ratio of Ce/Mo = 15:85 (b), 25:75 (c), 50:50 (d), 75:25
(e) • MoO 3 , * CeO 2
The data of CeO 2 -MoO 3 samples study by FT-IR method was presented in Fig.
18.2. It is necessary to note that presented spectrum of initial Ce/Mo = 50:50 composition (Fig. 18.2a) is a characteristic for all other initial samples. This spectrum
contains the wavenumbers at 933, 830, 804, 670, 626, and 416 cm −1 which can
be attributed to the Mo = O vibrations [15], ν s O-Mo-O symmetric stretching of
the distorted octahedral [MoO 6 ] units [16], ν Mo-O vibrations [17], symmetric
stretching vibrations in bridging ν s Ce-O-Ce linkages, distorted octahedral [MoO 6 ]
units assigned as an asymmetric stretching ν as O-Mo-O, and ν as Ce-O terminal
bonds of stretching modes, respectively.
It was found that UST leads to a change of samples spectra (Fig. 18.2b–e). The
shift of the terminal νMo = O band from 933 cm −1 up to 954 cm −1 which is
301
Fig. 18.1 Diffractograms of the composition ´È± 2 -MoO 3 : initial composition (Ce/Mo = 50:50)
(a), after UST for the compositions with ratio of Ce/Mo = 15:85 (b), 25:75 (c), 50:50 (d), 75:25
(e) • MoO 3 , * CeO 2
The data of CeO 2 -MoO 3 samples study by FT-IR method was presented in Fig.
18.2. It is necessary to note that presented spectrum of initial Ce/Mo = 50:50 composition (Fig. 18.2a) is a characteristic for all other initial samples. This spectrum
contains the wavenumbers at 933, 830, 804, 670, 626, and 416 cm −1 which can
be attributed to the Mo = O vibrations [15], ν s O-Mo-O symmetric stretching of
the distorted octahedral [MoO 6 ] units [16], ν Mo-O vibrations [17], symmetric
stretching vibrations in bridging ν s Ce-O-Ce linkages, distorted octahedral [MoO 6 ]
units assigned as an asymmetric stretching ν as O-Mo-O, and ν as Ce-O terminal
bonds of stretching modes, respectively.
It was found that UST leads to a change of samples spectra (Fig. 18.2b–e). The
shift of the terminal νMo = O band from 933 cm −1 up to 954 cm −1 which is