

212
O. Nadtoka et al.
50
100
150
200
0
2
4
6
8
10
12
4 * 10
-2 g/ml
6 * 10
-2 g/ml
8 * 10
-2 g/ml
Heat Flow, mV
Temperature,
o
C
50
100
150
-4
-2
0
2
4 * 10
-2 g/ml
6 * 10
-2 g/ml
8 * 10
-2 g/ml
Heat Flow
Temperature,
o C
a) heating process
b) cooling process
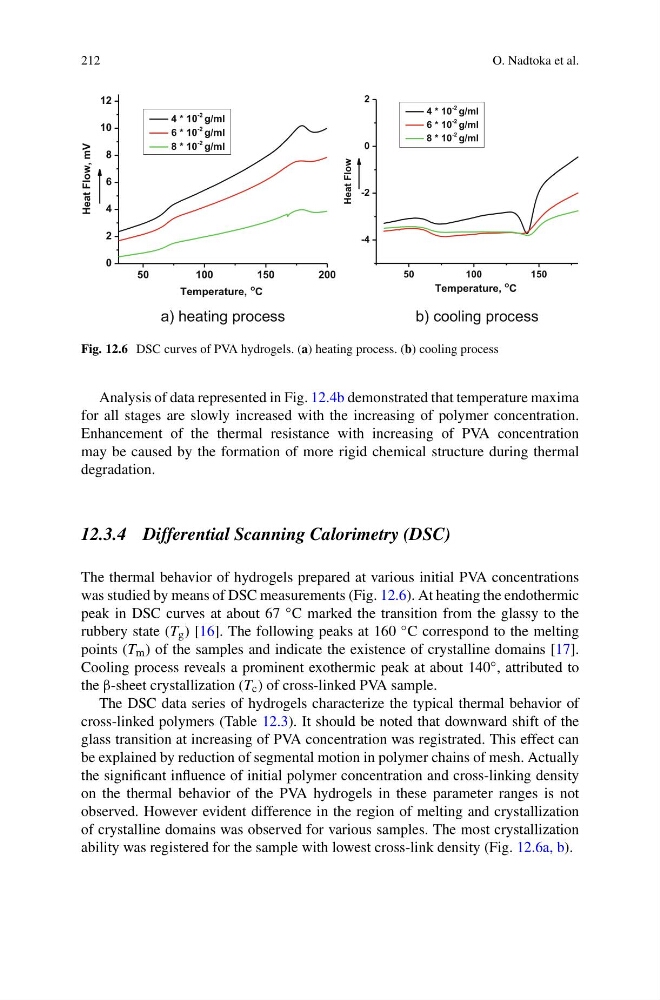
Fig. 12.6 DSC curves of PVA hydrogels. (a) heating process. (b) cooling process
Analysis of data represented in Fig. 12.4b demonstrated that temperature maxima
for all stages are slowly increased with the increasing of polymer concentration.
Enhancement of the thermal resistance with increasing of PVA concentration
may be caused by the formation of more rigid chemical structure during thermal
degradation.
12.3.4 Differential Scanning Calorimetry (DSC)
The thermal behavior of hydrogels prepared at various initial PVA concentrations
was studied by means of DSC measurements (Fig. 12.6). At heating the endothermic
peak in DSC curves at about 67 ◦ C marked the transition from the glassy to the
rubbery state (T g ) [16]. The following peaks at 160 ◦ C correspond to the melting
points (T m ) of the samples and indicate the existence of crystalline domains [17].
Cooling process reveals a prominent exothermic peak at about 140 ◦ , attributed to
the β-sheet crystallization (T c ) of cross-linked PVA sample.
The DSC data series of hydrogels characterize the typical thermal behavior of
cross-linked polymers (Table 12.3). It should be noted that downward shift of the
glass transition at increasing of PVA concentration was registrated. This effect can
be explained by reduction of segmental motion in polymer chains of mesh. Actually
the significant influence of initial polymer concentration and cross-linking density
on the thermal behavior of the PVA hydrogels in these parameter ranges is not
observed. However evident difference in the region of melting and crystallization
of crystalline domains was observed for various samples. The most crystallization
ability was registered for the sample with lowest cross-link density (Fig. 12.6a, b).
O. Nadtoka et al.
50
100
150
200
0
2
4
6
8
10
12
4 * 10
-2 g/ml
6 * 10
-2 g/ml
8 * 10
-2 g/ml
Heat Flow, mV
Temperature,
o
C
50
100
150
-4
-2
0
2
4 * 10
-2 g/ml
6 * 10
-2 g/ml
8 * 10
-2 g/ml
Heat Flow
Temperature,
o C
a) heating process
b) cooling process
Fig. 12.6 DSC curves of PVA hydrogels. (a) heating process. (b) cooling process
Analysis of data represented in Fig. 12.4b demonstrated that temperature maxima
for all stages are slowly increased with the increasing of polymer concentration.
Enhancement of the thermal resistance with increasing of PVA concentration
may be caused by the formation of more rigid chemical structure during thermal
degradation.
12.3.4 Differential Scanning Calorimetry (DSC)
The thermal behavior of hydrogels prepared at various initial PVA concentrations
was studied by means of DSC measurements (Fig. 12.6). At heating the endothermic
peak in DSC curves at about 67 ◦ C marked the transition from the glassy to the
rubbery state (T g ) [16]. The following peaks at 160 ◦ C correspond to the melting
points (T m ) of the samples and indicate the existence of crystalline domains [17].
Cooling process reveals a prominent exothermic peak at about 140 ◦ , attributed to
the β-sheet crystallization (T c ) of cross-linked PVA sample.
The DSC data series of hydrogels characterize the typical thermal behavior of
cross-linked polymers (Table 12.3). It should be noted that downward shift of the
glass transition at increasing of PVA concentration was registrated. This effect can
be explained by reduction of segmental motion in polymer chains of mesh. Actually
the significant influence of initial polymer concentration and cross-linking density
on the thermal behavior of the PVA hydrogels in these parameter ranges is not
observed. However evident difference in the region of melting and crystallization
of crystalline domains was observed for various samples. The most crystallization
ability was registered for the sample with lowest cross-link density (Fig. 12.6a, b).