

210
O. Nadtoka et al.
Table 12.1 Elastic module ¨ extension, elastic limit σ ¨, and yield point σ T, of cross-linked
polymers
C PVA 10 2 , g/ml
Static elastic module ¨ at
extension, -PÃ
Elastic limit σ ¨, KPa Yield point σ T, -PÃ
4
69,0
38
48
6
105,3
43
82
8
272,3
73
108
0
200
400
600
800
0
20
40
60
80
100
120
4 * 10 -2 g/ml
6 * 10 -2 g/ml
8 * 10 -2 g/ml
weight loss,%
Temperature,
0 C
0
100
200
300
400
500
600
-0,8
-0,6
-0,4
-0,2
0,0
dm/dT, %/
0
C
Temperature,
0 C
4 * 10 -2 g/ml
6 * 10 -2 g/ml
8 * 10 -2 g/ml
a)
b)
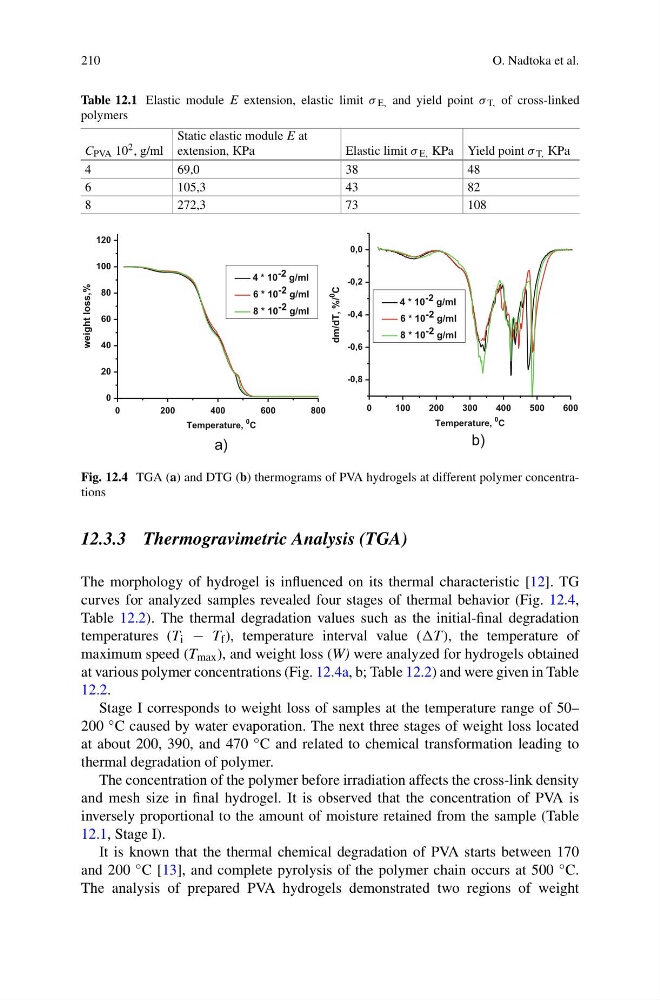
Fig. 12.4 TGA (a) and DTG (b) thermograms of PVA hydrogels at different polymer concentrations
12.3.3 Thermogravimetric Analysis (TGA)
The morphology of hydrogel is influenced on its thermal characteristic [12]. TG
curves for analyzed samples revealed four stages of thermal behavior (Fig. 12.4,
Table 12.2). The thermal degradation values such as the initial-final degradation
temperatures (T i − T f ), temperature interval value (T), the temperature of
maximum speed (T max ), and weight loss (W) were analyzed for hydrogels obtained
at various polymer concentrations (Fig. 12.4a, b; Table 12.2) and were given in Table
12.2.
Stage I corresponds to weight loss of samples at the temperature range of 50–
200 ◦ C caused by water evaporation. The next three stages of weight loss located
at about 200, 390, and 470 ◦ C and related to chemical transformation leading to
thermal degradation of polymer.
The concentration of the polymer before irradiation affects the cross-link density
and mesh size in final hydrogel. It is observed that the concentration of PVA is
inversely proportional to the amount of moisture retained from the sample (Table
12.1, Stage I).
It is known that the thermal chemical degradation of PVA starts between 170
and 200 ◦ C [13], and complete pyrolysis of the polymer chain occurs at 500 ◦ C.
The analysis of prepared PVA hydrogels demonstrated two regions of weight
O. Nadtoka et al.
Table 12.1 Elastic module ¨ extension, elastic limit σ ¨, and yield point σ T, of cross-linked
polymers
C PVA 10 2 , g/ml
Static elastic module ¨ at
extension, -PÃ
Elastic limit σ ¨, KPa Yield point σ T, -PÃ
4
69,0
38
48
6
105,3
43
82
8
272,3
73
108
0
200
400
600
800
0
20
40
60
80
100
120
4 * 10 -2 g/ml
6 * 10 -2 g/ml
8 * 10 -2 g/ml
weight loss,%
Temperature,
0 C
0
100
200
300
400
500
600
-0,8
-0,6
-0,4
-0,2
0,0
dm/dT, %/
0
C
Temperature,
0 C
4 * 10 -2 g/ml
6 * 10 -2 g/ml
8 * 10 -2 g/ml
a)
b)
Fig. 12.4 TGA (a) and DTG (b) thermograms of PVA hydrogels at different polymer concentrations
12.3.3 Thermogravimetric Analysis (TGA)
The morphology of hydrogel is influenced on its thermal characteristic [12]. TG
curves for analyzed samples revealed four stages of thermal behavior (Fig. 12.4,
Table 12.2). The thermal degradation values such as the initial-final degradation
temperatures (T i − T f ), temperature interval value (T), the temperature of
maximum speed (T max ), and weight loss (W) were analyzed for hydrogels obtained
at various polymer concentrations (Fig. 12.4a, b; Table 12.2) and were given in Table
12.2.
Stage I corresponds to weight loss of samples at the temperature range of 50–
200 ◦ C caused by water evaporation. The next three stages of weight loss located
at about 200, 390, and 470 ◦ C and related to chemical transformation leading to
thermal degradation of polymer.
The concentration of the polymer before irradiation affects the cross-link density
and mesh size in final hydrogel. It is observed that the concentration of PVA is
inversely proportional to the amount of moisture retained from the sample (Table
12.1, Stage I).
It is known that the thermal chemical degradation of PVA starts between 170
and 200 ◦ C [13], and complete pyrolysis of the polymer chain occurs at 500 ◦ C.
The analysis of prepared PVA hydrogels demonstrated two regions of weight