

11 Structure and Electrical/Dielectric Properties of Ion-Conductive Polymer. . .
189
site links. That is confirmed by presence of one diffraction peak (calculated from
the angular half-width) of the diffusion type (amorphous halo), in which the angular
position (2\) is about 20.0 ◦ .
The average value of the period (d) of a short-range molecular ordering of DEG1 internodal molecular segments in a polymer volume can be calculated using Bragg
equation:
d = λ(2 sin θ m )
−1
(11.3)
where λ is the wavelength of the characteristic X-ray emission (λ = 1.54 Å for ´u
K α emission) and it equals to 4.44 Å.
However, the introduction of LiClO 4 salt that has a crystalline structure into the
epoxy resin is accompanied by changes in the diffraction pattern. This is evidenced
by the presence of subtle diffraction peak of the diffuse type at 2θ m ≈ 12.2 ◦ on
the background of the amorphous halo, which is similar to the angular position of
the DEG-1 at 2θ m ≈ 20.0 ◦ (d ≈ 4.39 Å). According to [50], this diffraction peak
characterizes the existence of metal-polymer complexes of the donor-acceptor type,
in our case, between central ions (Li + ) and ether oxygen of the epoxy chains in the
intermolecular volume of the epoxy resin.
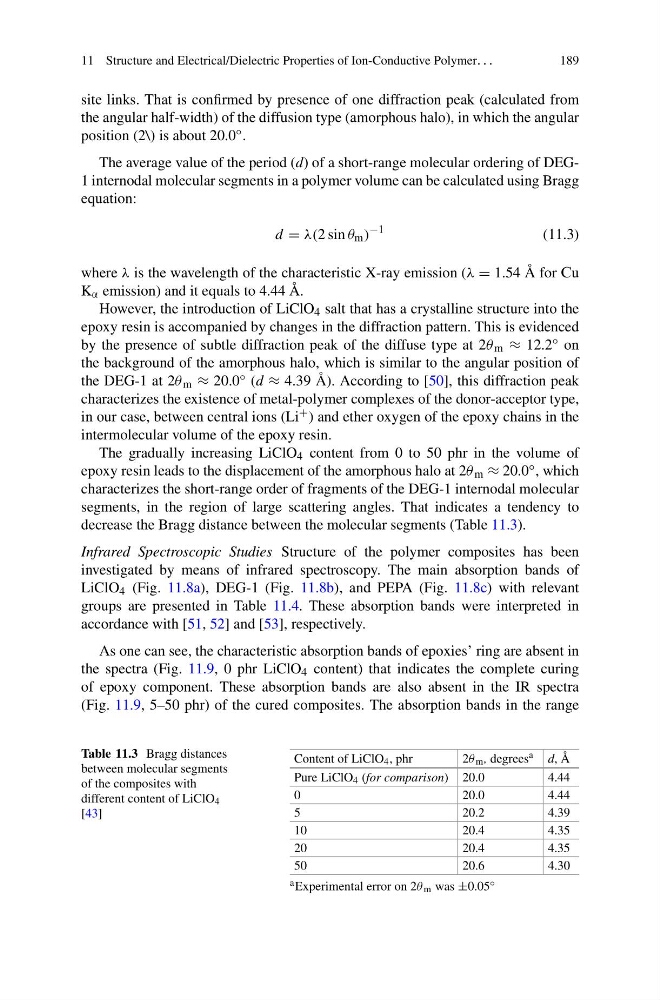
The gradually increasing LiClO 4 content from 0 to 50 phr in the volume of
epoxy resin leads to the displacement of the amorphous halo at 2θ m ≈ 20.0 ◦ , which
characterizes the short-range order of fragments of the DEG-1 internodal molecular
segments, in the region of large scattering angles. That indicates a tendency to
decrease the Bragg distance between the molecular segments (Table 11.3).
Infrared Spectroscopic Studies Structure of the polymer composites has been
investigated by means of infrared spectroscopy. The main absorption bands of
LiClO 4 (Fig. 11.8a), DEG-1 (Fig. 11.8b), and PEPA (Fig. 11.8c) with relevant
groups are presented in Table 11.4. These absorption bands were interpreted in
accordance with [51, 52] and [53], respectively.
As one can see, the characteristic absorption bands of epoxies’ ring are absent in
the spectra (Fig. 11.9, 0 phr LiClO 4 content) that indicates the complete curing
of epoxy component. These absorption bands are also absent in the IR spectra
(Fig. 11.9, 5–50 phr) of the cured composites. The absorption bands in the range
Table 11.3 Bragg distances
between molecular segments
of the composites with
different content of LiClO 4
[43]
Content of LiClO 4 , phr
2θ m , degrees a d, Å
Pure LiClO 4 (for comparison) 20.0
4.44
0
20.0
4.44
5
20.2
4.39
10
20.4
4.35
20
20.4
4.35
50
20.6
4.30
a Experimental error on 2θ m was ±0.05 ◦
189
site links. That is confirmed by presence of one diffraction peak (calculated from
the angular half-width) of the diffusion type (amorphous halo), in which the angular
position (2\) is about 20.0 ◦ .
The average value of the period (d) of a short-range molecular ordering of DEG1 internodal molecular segments in a polymer volume can be calculated using Bragg
equation:
d = λ(2 sin θ m )
−1
(11.3)
where λ is the wavelength of the characteristic X-ray emission (λ = 1.54 Å for ´u
K α emission) and it equals to 4.44 Å.
However, the introduction of LiClO 4 salt that has a crystalline structure into the
epoxy resin is accompanied by changes in the diffraction pattern. This is evidenced
by the presence of subtle diffraction peak of the diffuse type at 2θ m ≈ 12.2 ◦ on
the background of the amorphous halo, which is similar to the angular position of
the DEG-1 at 2θ m ≈ 20.0 ◦ (d ≈ 4.39 Å). According to [50], this diffraction peak
characterizes the existence of metal-polymer complexes of the donor-acceptor type,
in our case, between central ions (Li + ) and ether oxygen of the epoxy chains in the
intermolecular volume of the epoxy resin.
The gradually increasing LiClO 4 content from 0 to 50 phr in the volume of
epoxy resin leads to the displacement of the amorphous halo at 2θ m ≈ 20.0 ◦ , which
characterizes the short-range order of fragments of the DEG-1 internodal molecular
segments, in the region of large scattering angles. That indicates a tendency to
decrease the Bragg distance between the molecular segments (Table 11.3).
Infrared Spectroscopic Studies Structure of the polymer composites has been
investigated by means of infrared spectroscopy. The main absorption bands of
LiClO 4 (Fig. 11.8a), DEG-1 (Fig. 11.8b), and PEPA (Fig. 11.8c) with relevant
groups are presented in Table 11.4. These absorption bands were interpreted in
accordance with [51, 52] and [53], respectively.
As one can see, the characteristic absorption bands of epoxies’ ring are absent in
the spectra (Fig. 11.9, 0 phr LiClO 4 content) that indicates the complete curing
of epoxy component. These absorption bands are also absent in the IR spectra
(Fig. 11.9, 5–50 phr) of the cured composites. The absorption bands in the range
Table 11.3 Bragg distances
between molecular segments
of the composites with
different content of LiClO 4
[43]
Content of LiClO 4 , phr
2θ m , degrees a d, Å
Pure LiClO 4 (for comparison) 20.0
4.44
0
20.0
4.44
5
20.2
4.39
10
20.4
4.35
20
20.4
4.35
50
20.6
4.30
a Experimental error on 2θ m was ±0.05 ◦