

154
R. Kozakevych et al.
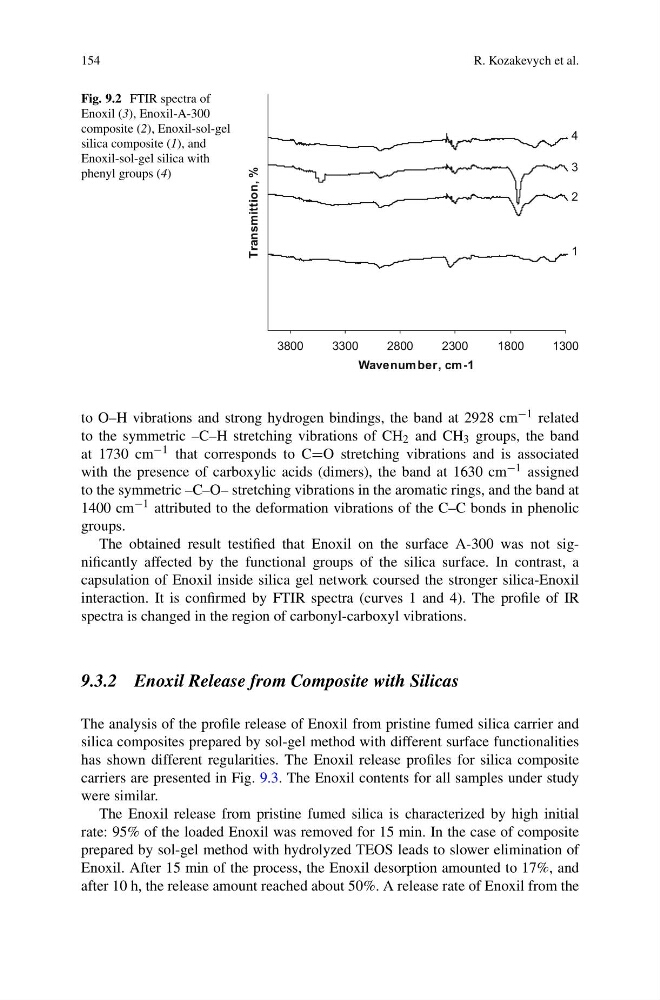
Fig. 9.2 FTIR spectra of
Enoxil (3), Enoxil-A-300
composite (2), Enoxil-sol-gel
silica composite (1), and
Enoxil-sol-gel silica with
phenyl groups (4)
1300
1800
2300
2800
3300
3800
Wavenum ber, cm-1
Transmittion, %
1
2
3
4
to O–H vibrations and strong hydrogen bindings, the band at 2928 cm −1 related
to the symmetric –C–H stretching vibrations of CH 2 and CH 3 groups, the band
at 1730 cm −1 that corresponds to C=O stretching vibrations and is associated
with the presence of carboxylic acids (dimers), the band at 1630 cm −1 assigned
to the symmetric –C–O– stretching vibrations in the aromatic rings, and the band at
1400 cm −1 attributed to the deformation vibrations of the C–C bonds in phenolic
groups.
The obtained result testified that Enoxil on the surface A-300 was not significantly affected by the functional groups of the silica surface. In contrast, a
capsulation of Enoxil inside silica gel network coursed the stronger silica-Enoxil
interaction. It is confirmed by FTIR spectra (curves 1 and 4). The profile of IR
spectra is changed in the region of carbonyl-carboxyl vibrations.
9.3.2 Enoxil Release from Composite with Silicas
The analysis of the profile release of Enoxil from pristine fumed silica carrier and
silica composites prepared by sol-gel method with different surface functionalities
has shown different regularities. The Enoxil release profiles for silica composite
carriers are presented in Fig. 9.3. The Enoxil contents for all samples under study
were similar.
The Enoxil release from pristine fumed silica is characterized by high initial
rate: 95% of the loaded Enoxil was removed for 15 min. In the case of composite
prepared by sol-gel method with hydrolyzed TEOS leads to slower elimination of
Enoxil. After 15 min of the process, the Enoxil desorption amounted to 17%, and
after 10 h, the release amount reached about 50%. A release rate of Enoxil from the
R. Kozakevych et al.
Fig. 9.2 FTIR spectra of
Enoxil (3), Enoxil-A-300
composite (2), Enoxil-sol-gel
silica composite (1), and
Enoxil-sol-gel silica with
phenyl groups (4)
1300
1800
2300
2800
3300
3800
Wavenum ber, cm-1
Transmittion, %
1
2
3
4
to O–H vibrations and strong hydrogen bindings, the band at 2928 cm −1 related
to the symmetric –C–H stretching vibrations of CH 2 and CH 3 groups, the band
at 1730 cm −1 that corresponds to C=O stretching vibrations and is associated
with the presence of carboxylic acids (dimers), the band at 1630 cm −1 assigned
to the symmetric –C–O– stretching vibrations in the aromatic rings, and the band at
1400 cm −1 attributed to the deformation vibrations of the C–C bonds in phenolic
groups.
The obtained result testified that Enoxil on the surface A-300 was not significantly affected by the functional groups of the silica surface. In contrast, a
capsulation of Enoxil inside silica gel network coursed the stronger silica-Enoxil
interaction. It is confirmed by FTIR spectra (curves 1 and 4). The profile of IR
spectra is changed in the region of carbonyl-carboxyl vibrations.
9.3.2 Enoxil Release from Composite with Silicas
The analysis of the profile release of Enoxil from pristine fumed silica carrier and
silica composites prepared by sol-gel method with different surface functionalities
has shown different regularities. The Enoxil release profiles for silica composite
carriers are presented in Fig. 9.3. The Enoxil contents for all samples under study
were similar.
The Enoxil release from pristine fumed silica is characterized by high initial
rate: 95% of the loaded Enoxil was removed for 15 min. In the case of composite
prepared by sol-gel method with hydrolyzed TEOS leads to slower elimination of
Enoxil. After 15 min of the process, the Enoxil desorption amounted to 17%, and
after 10 h, the release amount reached about 50%. A release rate of Enoxil from the