

9 Polymeric Composite Films with Controlled Release of Natural Antioxidant Enoxil
153
y = 1,774x + 0,038
R
2 = 0,9989
0
0,1
0,2
0,3
0,4
0,5
0,6
0
0,05
0,1
0,15
0,2
0,25
0,3
0,35
С, g/l
D
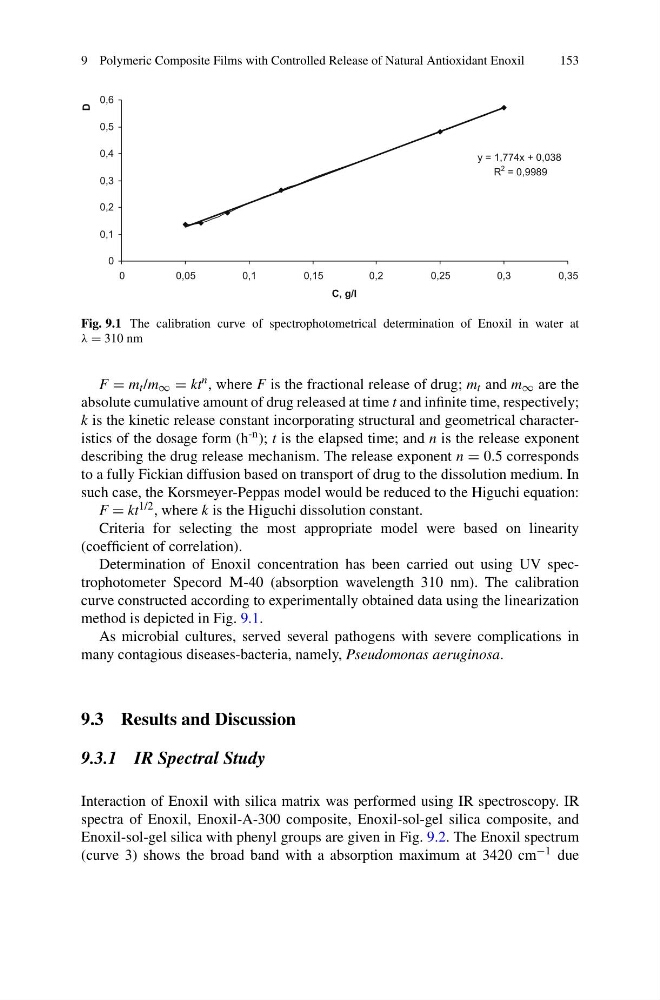
Fig. 9.1 The calibration curve of spectrophotometrical determination of Enoxil in water at
λ = 310 nm
F = m t /m ∞ = kt n , where F is the fractional release of drug; m t and m ∞ are the
absolute cumulative amount of drug released at time t and infinite time, respectively;
k is the kinetic release constant incorporating structural and geometrical characteristics of the dosage form (h -n ); t is the elapsed time; and n is the release exponent
describing the drug release mechanism. The release exponent n = 0.5 corresponds
to a fully Fickian diffusion based on transport of drug to the dissolution medium. In
such case, the Korsmeyer-Peppas model would be reduced to the Higuchi equation:
F = kt 1/2 , where k is the Higuchi dissolution constant.
Criteria for selecting the most appropriate model were based on linearity
(coefficient of correlation).
Determination of Enoxil concentration has been carried out using UV spectrophotometer Specord ¯-40 (absorption wavelength 310 nm). The calibration
curve constructed according to experimentally obtained data using the linearization
method is depicted in Fig. 9.1.
As microbial cultures, served several pathogens with severe complications in
many contagious diseases-bacteria, namely, Pseudomonas aeruginosa.
9.3 Results and Discussion
9.3.1 IR Spectral Study
Interaction of Enoxil with silica matrix was performed using IR spectroscopy. IR
spectra of Enoxil, Enoxil-A-300 composite, Enoxil-sol-gel silica composite, and
Enoxil-sol-gel silica with phenyl groups are given in Fig. 9.2. The Enoxil spectrum
(curve 3) shows the broad band with a absorption maximum at 3420 cm −1 due
153
y = 1,774x + 0,038
R
2 = 0,9989
0
0,1
0,2
0,3
0,4
0,5
0,6
0
0,05
0,1
0,15
0,2
0,25
0,3
0,35
С, g/l
D
Fig. 9.1 The calibration curve of spectrophotometrical determination of Enoxil in water at
λ = 310 nm
F = m t /m ∞ = kt n , where F is the fractional release of drug; m t and m ∞ are the
absolute cumulative amount of drug released at time t and infinite time, respectively;
k is the kinetic release constant incorporating structural and geometrical characteristics of the dosage form (h -n ); t is the elapsed time; and n is the release exponent
describing the drug release mechanism. The release exponent n = 0.5 corresponds
to a fully Fickian diffusion based on transport of drug to the dissolution medium. In
such case, the Korsmeyer-Peppas model would be reduced to the Higuchi equation:
F = kt 1/2 , where k is the Higuchi dissolution constant.
Criteria for selecting the most appropriate model were based on linearity
(coefficient of correlation).
Determination of Enoxil concentration has been carried out using UV spectrophotometer Specord ¯-40 (absorption wavelength 310 nm). The calibration
curve constructed according to experimentally obtained data using the linearization
method is depicted in Fig. 9.1.
As microbial cultures, served several pathogens with severe complications in
many contagious diseases-bacteria, namely, Pseudomonas aeruginosa.
9.3 Results and Discussion
9.3.1 IR Spectral Study
Interaction of Enoxil with silica matrix was performed using IR spectroscopy. IR
spectra of Enoxil, Enoxil-A-300 composite, Enoxil-sol-gel silica composite, and
Enoxil-sol-gel silica with phenyl groups are given in Fig. 9.2. The Enoxil spectrum
(curve 3) shows the broad band with a absorption maximum at 3420 cm −1 due