

134
L. V. Karabanova et al.
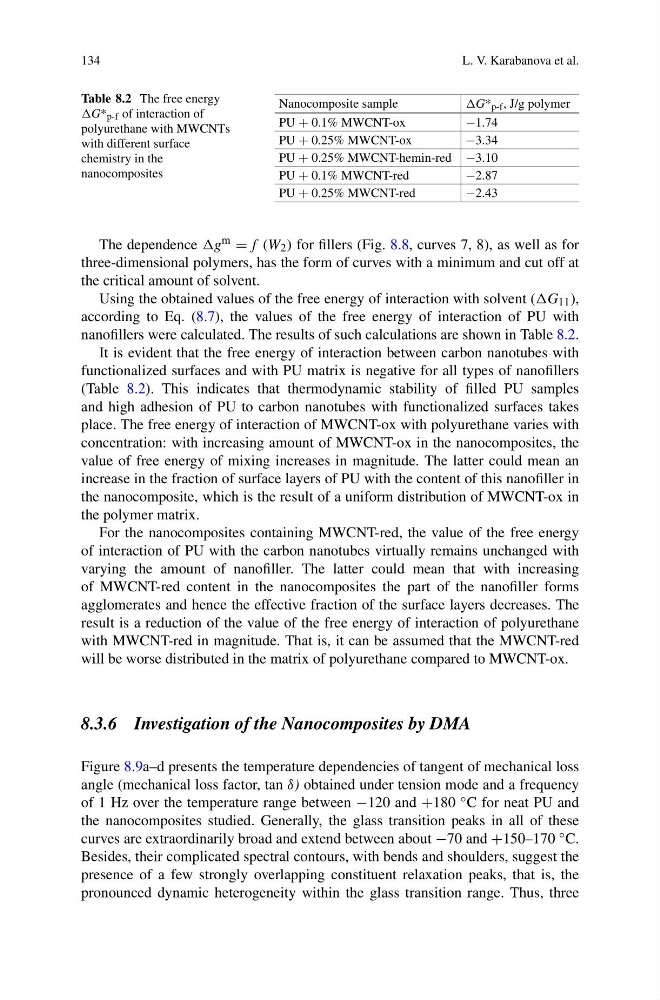
Table 8.2 The free energy
G* p-f of interaction of
polyurethane with MWCNTs
with different surface
chemistry in the
nanocomposites
Nanocomposite sample
G* p-f , J/g polymer
PU + 0.1% MWCNT-ox
−1.74
PU + 0.25% MWCNT-ox
−3.34
PU + 0.25% MWCNT-hemin-red −3.10
PU + 0.1% MWCNT-red
−2.87
PU + 0.25% MWCNT-red
−2.43
The dependence g m = f (W 2 ) for fillers (Fig. 8.8, curves 7, 8), as well as for
three-dimensional polymers, has the form of curves with a minimum and cut off at
the critical amount of solvent.
Using the obtained values of the free energy of interaction with solvent (G 11 ),
according to Eq. (8.7), the values of the free energy of interaction of PU with
nanofillers were calculated. The results of such calculations are shown in Table 8.2.
It is evident that the free energy of interaction between carbon nanotubes with
functionalized surfaces and with PU matrix is negative for all types of nanofillers
(Table 8.2). This indicates that thermodynamic stability of filled PU samples
and high adhesion of PU to carbon nanotubes with functionalized surfaces takes
place. The free energy of interaction of MWCNT-ox with polyurethane varies with
concentration: with increasing amount of MWCNT-ox in the nanocomposites, the
value of free energy of mixing increases in magnitude. The latter could mean an
increase in the fraction of surface layers of PU with the content of this nanofiller in
the nanocomposite, which is the result of a uniform distribution of MWCNT-ox in
the polymer matrix.
For the nanocomposites containing MWCNT-red, the value of the free energy
of interaction of PU with the carbon nanotubes virtually remains unchanged with
varying the amount of nanofiller. The latter could mean that with increasing
of MWCNT-red content in the nanocomposites the part of the nanofiller forms
agglomerates and hence the effective fraction of the surface layers decreases. The
result is a reduction of the value of the free energy of interaction of polyurethane
with MWCNT-red in magnitude. That is, it can be assumed that the MWCNT-red
will be worse distributed in the matrix of polyurethane compared to MWCNT-ox.
8.3.6 Investigation of the Nanocomposites by DMA
Figure 8.9a–d presents the temperature dependencies of tangent of mechanical loss
angle (mechanical loss factor, tan δ) obtained under tension mode and a frequency
of 1 Hz over the temperature range between −120 and +180 ◦ C for neat PU and
the nanocomposites studied. Generally, the glass transition peaks in all of these
curves are extraordinarily broad and extend between about −70 and +150–170 ◦ C.
Besides, their complicated spectral contours, with bends and shoulders, suggest the
presence of a few strongly overlapping constituent relaxation peaks, that is, the
pronounced dynamic heterogeneity within the glass transition range. Thus, three
L. V. Karabanova et al.
Table 8.2 The free energy
G* p-f of interaction of
polyurethane with MWCNTs
with different surface
chemistry in the
nanocomposites
Nanocomposite sample
G* p-f , J/g polymer
PU + 0.1% MWCNT-ox
−1.74
PU + 0.25% MWCNT-ox
−3.34
PU + 0.25% MWCNT-hemin-red −3.10
PU + 0.1% MWCNT-red
−2.87
PU + 0.25% MWCNT-red
−2.43
The dependence g m = f (W 2 ) for fillers (Fig. 8.8, curves 7, 8), as well as for
three-dimensional polymers, has the form of curves with a minimum and cut off at
the critical amount of solvent.
Using the obtained values of the free energy of interaction with solvent (G 11 ),
according to Eq. (8.7), the values of the free energy of interaction of PU with
nanofillers were calculated. The results of such calculations are shown in Table 8.2.
It is evident that the free energy of interaction between carbon nanotubes with
functionalized surfaces and with PU matrix is negative for all types of nanofillers
(Table 8.2). This indicates that thermodynamic stability of filled PU samples
and high adhesion of PU to carbon nanotubes with functionalized surfaces takes
place. The free energy of interaction of MWCNT-ox with polyurethane varies with
concentration: with increasing amount of MWCNT-ox in the nanocomposites, the
value of free energy of mixing increases in magnitude. The latter could mean an
increase in the fraction of surface layers of PU with the content of this nanofiller in
the nanocomposite, which is the result of a uniform distribution of MWCNT-ox in
the polymer matrix.
For the nanocomposites containing MWCNT-red, the value of the free energy
of interaction of PU with the carbon nanotubes virtually remains unchanged with
varying the amount of nanofiller. The latter could mean that with increasing
of MWCNT-red content in the nanocomposites the part of the nanofiller forms
agglomerates and hence the effective fraction of the surface layers decreases. The
result is a reduction of the value of the free energy of interaction of polyurethane
with MWCNT-red in magnitude. That is, it can be assumed that the MWCNT-red
will be worse distributed in the matrix of polyurethane compared to MWCNT-ox.
8.3.6 Investigation of the Nanocomposites by DMA
Figure 8.9a–d presents the temperature dependencies of tangent of mechanical loss
angle (mechanical loss factor, tan δ) obtained under tension mode and a frequency
of 1 Hz over the temperature range between −120 and +180 ◦ C for neat PU and
the nanocomposites studied. Generally, the glass transition peaks in all of these
curves are extraordinarily broad and extend between about −70 and +150–170 ◦ C.
Besides, their complicated spectral contours, with bends and shoulders, suggest the
presence of a few strongly overlapping constituent relaxation peaks, that is, the
pronounced dynamic heterogeneity within the glass transition range. Thus, three