

8 Nanocomposites Based on Thermosetting Polyurethane Matrix. . .
135
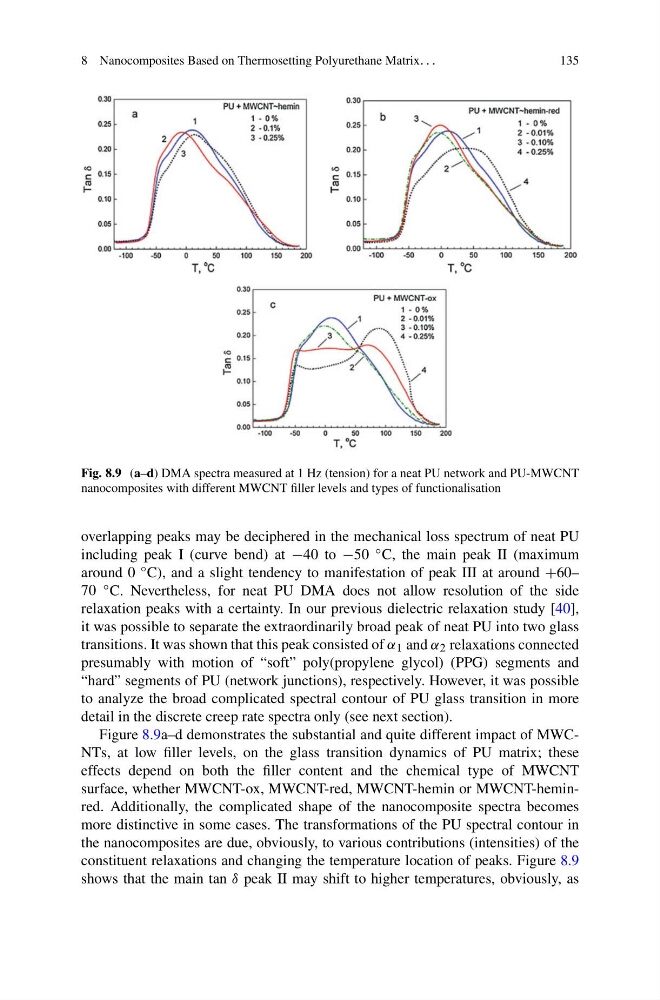
Fig. 8.9 (a–d) DMA spectra measured at 1 Hz (tension) for a neat PU network and PU-MWCNT
nanocomposites with different MWCNT filler levels and types of functionalisation
overlapping peaks may be deciphered in the mechanical loss spectrum of neat PU
including peak I (curve bend) at −40 to −50 ◦ C, the main peak II (maximum
around 0 ◦ C), and a slight tendency to manifestation of peak III at around +60–
70 ◦ C. Nevertheless, for neat PU DMA does not allow resolution of the side
relaxation peaks with a certainty. In our previous dielectric relaxation study [40],
it was possible to separate the extraordinarily broad peak of neat PU into two glass
transitions. It was shown that this peak consisted of α 1 and α 2 relaxations connected
presumably with motion of “soft” poly(propylene glycol) (PPG) segments and
“hard” segments of PU (network junctions), respectively. However, it was possible
to analyze the broad complicated spectral contour of PU glass transition in more
detail in the discrete creep rate spectra only (see next section).
Figure 8.9a–d demonstrates the substantial and quite different impact of MWCNTs, at low filler levels, on the glass transition dynamics of PU matrix; these
effects depend on both the filler content and the chemical type of MWCNT
surface, whether MWCNT-ox, MWCNT-red, MWCNT-hemin or MWCNT-heminred. Additionally, the complicated shape of the nanocomposite spectra becomes
more distinctive in some cases. The transformations of the PU spectral contour in
the nanocomposites are due, obviously, to various contributions (intensities) of the
constituent relaxations and changing the temperature location of peaks. Figure 8.9
shows that the main tan δ peak II may shift to higher temperatures, obviously, as
135
Fig. 8.9 (a–d) DMA spectra measured at 1 Hz (tension) for a neat PU network and PU-MWCNT
nanocomposites with different MWCNT filler levels and types of functionalisation
overlapping peaks may be deciphered in the mechanical loss spectrum of neat PU
including peak I (curve bend) at −40 to −50 ◦ C, the main peak II (maximum
around 0 ◦ C), and a slight tendency to manifestation of peak III at around +60–
70 ◦ C. Nevertheless, for neat PU DMA does not allow resolution of the side
relaxation peaks with a certainty. In our previous dielectric relaxation study [40],
it was possible to separate the extraordinarily broad peak of neat PU into two glass
transitions. It was shown that this peak consisted of α 1 and α 2 relaxations connected
presumably with motion of “soft” poly(propylene glycol) (PPG) segments and
“hard” segments of PU (network junctions), respectively. However, it was possible
to analyze the broad complicated spectral contour of PU glass transition in more
detail in the discrete creep rate spectra only (see next section).
Figure 8.9a–d demonstrates the substantial and quite different impact of MWCNTs, at low filler levels, on the glass transition dynamics of PU matrix; these
effects depend on both the filler content and the chemical type of MWCNT
surface, whether MWCNT-ox, MWCNT-red, MWCNT-hemin or MWCNT-heminred. Additionally, the complicated shape of the nanocomposite spectra becomes
more distinctive in some cases. The transformations of the PU spectral contour in
the nanocomposites are due, obviously, to various contributions (intensities) of the
constituent relaxations and changing the temperature location of peaks. Figure 8.9
shows that the main tan δ peak II may shift to higher temperatures, obviously, as