

211
Bowel Polyp Detection in Capsule Endoscopy Images
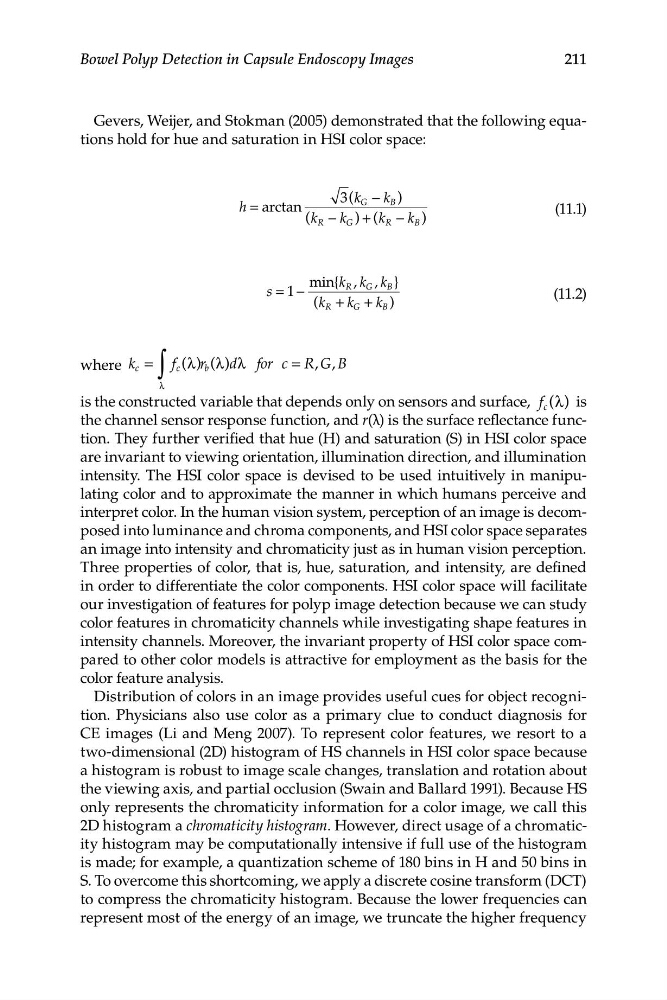
Gevers, Weijer, and Stokman (2005) demonstrated that the following equations hold for hue and saturation in HSI color space:
3(k
k
− )
h = arctan
G
B
(11.1)
(k
k
R − G ) + (k
k
R − B )
min{ k k
s = −
1
R , G , k B }
(11.2)
(k
k
R + +
G
k B )
where k c =
∫
f c ( )
λ r b ( )
λ dλ fo r c= R,G, B
λ
is the constructed variable that depends only on sensors and surface, f c ( )
λ is
the channel sensor response function, and r(λ) is the surface reflectance function. They further verified that hue (H) and saturation (S) in HSI color space
are invariant to viewing orientation, illumination direction, and illumination
intensity. The HSI color space is devised to be used intuitively in manipulating color and to approximate the manner in which humans perceive and
interpret color. In the human vision system, perception of an image is decomposed into luminance and chroma components, and HSI color space separates
an image into intensity and chromaticity just as in human vision perception.
Three properties of color, that is, hue, saturation, and intensity, are defined
in order to differentiate the color components. HSI color space will facilitate
our investigation of features for polyp image detection because we can study
color features in chromaticity channels while investigating shape features in
intensity channels. Moreover, the invariant property of HSI color space compared to other color models is attractive for employment as the basis for the
color feature analysis.
Distribution of colors in an image provides useful cues for object recognition. Physicians also use color as a primary clue to conduct diagnosis for
CE images (Li and Meng 2007). To represent color features, we resort to a
two-dimensional (2D) histogram of HS channels in HSI color space because
a histogram is robust to image scale changes, translation and rotation about
the viewing axis, and partial occlusion (Swain and Ballard 1991). Because HS
only represents the chromaticity information for a color image, we call this
2D histogram a chromaticity histogram. However, direct usage of a chromaticity histogram may be computationally intensive if full use of the histogram
is made; for example, a quantization scheme of 180 bins in H and 50 bins in
S. To overcome this shortcoming, we apply a discrete cosine transform (DCT)
to compress the chromaticity histogram. Because the lower frequencies can
represent most of the energy of an image, we truncate the higher frequency
Bowel Polyp Detection in Capsule Endoscopy Images
Gevers, Weijer, and Stokman (2005) demonstrated that the following equations hold for hue and saturation in HSI color space:
3(k
k
− )
h = arctan
G
B
(11.1)
(k
k
R − G ) + (k
k
R − B )
min{ k k
s = −
1
R , G , k B }
(11.2)
(k
k
R + +
G
k B )
where k c =
∫
f c ( )
λ r b ( )
λ dλ fo r c= R,G, B
λ
is the constructed variable that depends only on sensors and surface, f c ( )
λ is
the channel sensor response function, and r(λ) is the surface reflectance function. They further verified that hue (H) and saturation (S) in HSI color space
are invariant to viewing orientation, illumination direction, and illumination
intensity. The HSI color space is devised to be used intuitively in manipulating color and to approximate the manner in which humans perceive and
interpret color. In the human vision system, perception of an image is decomposed into luminance and chroma components, and HSI color space separates
an image into intensity and chromaticity just as in human vision perception.
Three properties of color, that is, hue, saturation, and intensity, are defined
in order to differentiate the color components. HSI color space will facilitate
our investigation of features for polyp image detection because we can study
color features in chromaticity channels while investigating shape features in
intensity channels. Moreover, the invariant property of HSI color space compared to other color models is attractive for employment as the basis for the
color feature analysis.
Distribution of colors in an image provides useful cues for object recognition. Physicians also use color as a primary clue to conduct diagnosis for
CE images (Li and Meng 2007). To represent color features, we resort to a
two-dimensional (2D) histogram of HS channels in HSI color space because
a histogram is robust to image scale changes, translation and rotation about
the viewing axis, and partial occlusion (Swain and Ballard 1991). Because HS
only represents the chromaticity information for a color image, we call this
2D histogram a chromaticity histogram. However, direct usage of a chromaticity histogram may be computationally intensive if full use of the histogram
is made; for example, a quantization scheme of 180 bins in H and 50 bins in
S. To overcome this shortcoming, we apply a discrete cosine transform (DCT)
to compress the chromaticity histogram. Because the lower frequencies can
represent most of the energy of an image, we truncate the higher frequency