

4000
Relax
Mind task
3000
2000
1000
0
Time (s)
Voltage (mV)
16
18
20
22
24
Measurement of Brain Activity Using Optical and Electrical Methods
201
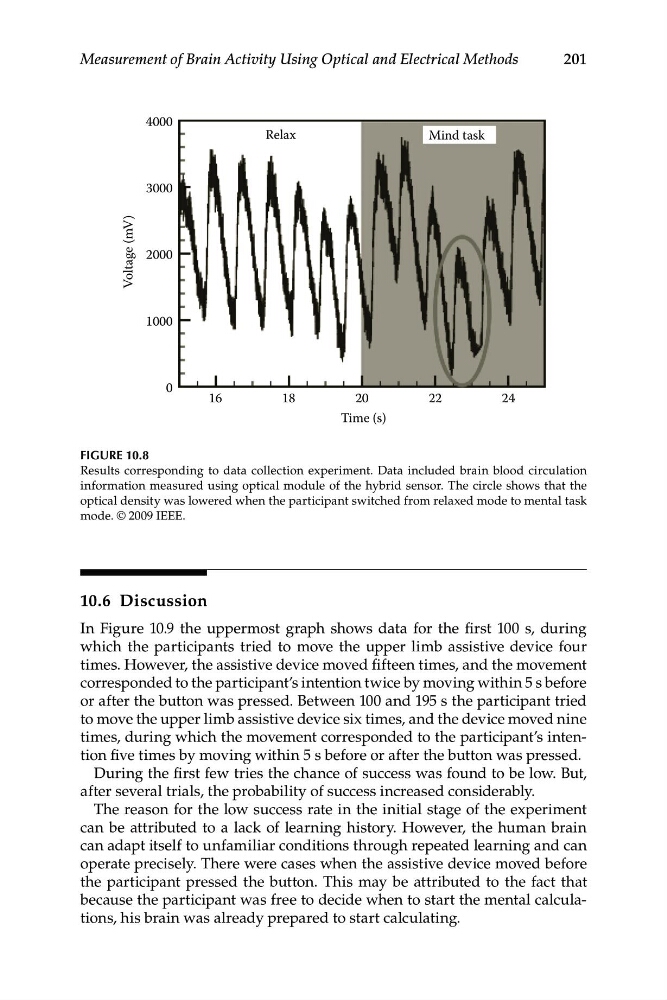
FIGURE 10.8
Results corresponding to data collection experiment. Data included brain blood circulation
information measured using optical module of the hybrid sensor. The circle shows that the
optical density was lowered when the participant switched from relaxed mode to mental task
mode. © 2009 IEEE.
10.6 Discussion
In Figure 10.9 the uppermost graph shows data for the first 100 s, during
which the participants tried to move the upper limb assistive device four
times. However, the assistive device moved fifteen times, and the movement
corresponded to the participant’s intention twice by moving within 5 s before
or after the button was pressed. Between 100 and 195 s the participant tried
to move the upper limb assistive device six times, and the device moved nine
times, during which the movement corresponded to the participant’s intention five times by moving within 5 s before or after the button was pressed.
During the first few tries the chance of success was found to be low. But,
after several trials, the probability of success increased considerably.
The reason for the low success rate in the initial stage of the experiment
can be attributed to a lack of learning history. However, the human brain
can adapt itself to unfamiliar conditions through repeated learning and can
operate precisely. There were cases when the assistive device moved before
the participant pressed the button. This may be attributed to the fact that
because the participant was free to decide when to start the mental calculations, his brain was already prepared to start calculating.
Relax
Mind task
3000
2000
1000
0
Time (s)
Voltage (mV)
16
18
20
22
24
Measurement of Brain Activity Using Optical and Electrical Methods
201
FIGURE 10.8
Results corresponding to data collection experiment. Data included brain blood circulation
information measured using optical module of the hybrid sensor. The circle shows that the
optical density was lowered when the participant switched from relaxed mode to mental task
mode. © 2009 IEEE.
10.6 Discussion
In Figure 10.9 the uppermost graph shows data for the first 100 s, during
which the participants tried to move the upper limb assistive device four
times. However, the assistive device moved fifteen times, and the movement
corresponded to the participant’s intention twice by moving within 5 s before
or after the button was pressed. Between 100 and 195 s the participant tried
to move the upper limb assistive device six times, and the device moved nine
times, during which the movement corresponded to the participant’s intention five times by moving within 5 s before or after the button was pressed.
During the first few tries the chance of success was found to be low. But,
after several trials, the probability of success increased considerably.
The reason for the low success rate in the initial stage of the experiment
can be attributed to a lack of learning history. However, the human brain
can adapt itself to unfamiliar conditions through repeated learning and can
operate precisely. There were cases when the assistive device moved before
the participant pressed the button. This may be attributed to the fact that
because the participant was free to decide when to start the mental calculations, his brain was already prepared to start calculating.