

202
Biologically Inspired Robotics
100
100
80
80
60
60
40
40
20
20
0
0
Time (s)
Angle (degree)
100
80
60
40
20
0
Angle (degree)
100
120
140
160
180
200
Time (s)
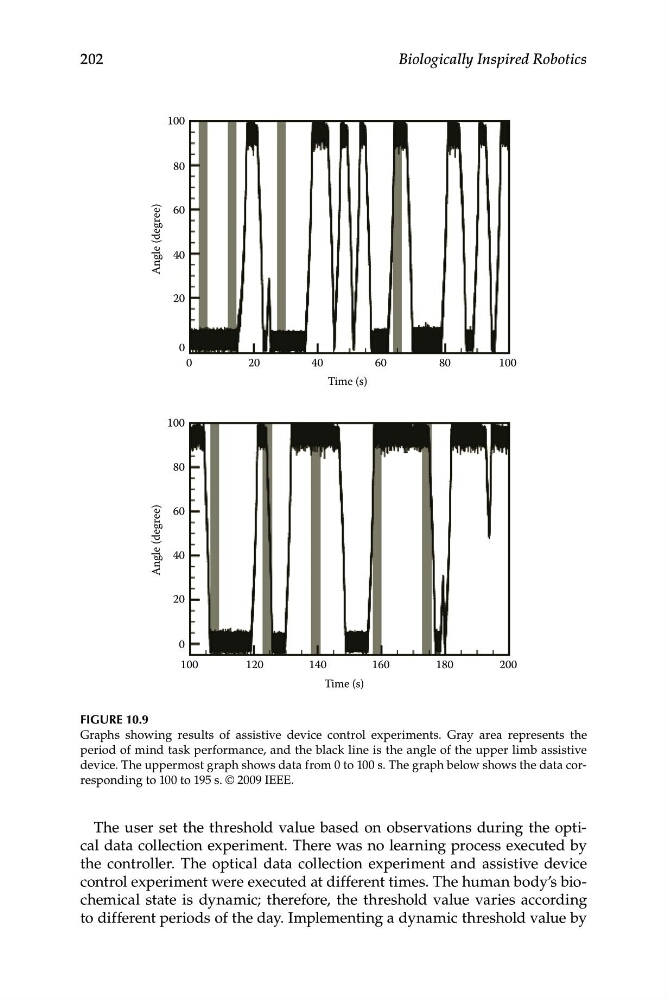
FIGURE 10.9
Graphs showing results of assistive device control experiments. Gray area represents the
period of mind task performance, and the black line is the angle of the upper limb assistive
device. The uppermost graph shows data from 0 to 100 s. The graph below shows the data corresponding to 100 to 195 s. © 2009 IEEE.
The user set the threshold value based on observations during the optical data collection experiment. There was no learning process executed by
the controller. The optical data collection experiment and assistive device
control experiment were executed at different times. The human body’s biochemical state is dynamic; therefore, the threshold value varies according
to different periods of the day. Implementing a dynamic threshold value by
Biologically Inspired Robotics
100
100
80
80
60
60
40
40
20
20
0
0
Time (s)
Angle (degree)
100
80
60
40
20
0
Angle (degree)
100
120
140
160
180
200
Time (s)
FIGURE 10.9
Graphs showing results of assistive device control experiments. Gray area represents the
period of mind task performance, and the black line is the angle of the upper limb assistive
device. The uppermost graph shows data from 0 to 100 s. The graph below shows the data corresponding to 100 to 195 s. © 2009 IEEE.
The user set the threshold value based on observations during the optical data collection experiment. There was no learning process executed by
the controller. The optical data collection experiment and assistive device
control experiment were executed at different times. The human body’s biochemical state is dynamic; therefore, the threshold value varies according
to different periods of the day. Implementing a dynamic threshold value by