

185
Nanorobotic Manipulation for a Single Biological Cell
Soft
nanoneedle
Cell
5 μm
5 μm
(a) Before buckling
(b) After buckling
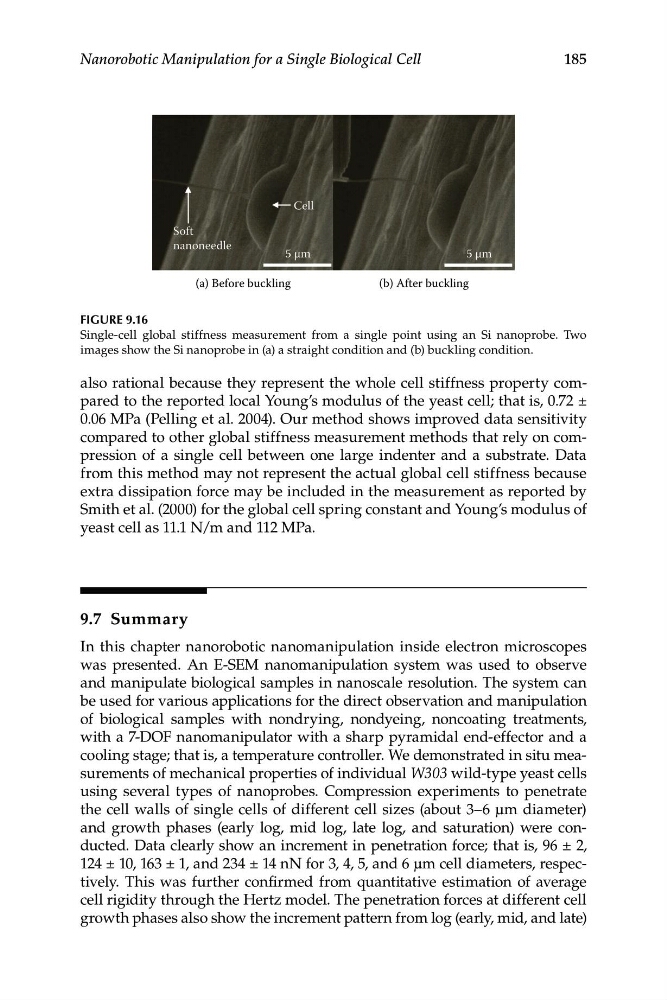
FIGURE 9.16
Single-cell global stiffness measurement from a single point using an Si nanoprobe. Two
images show the Si nanoprobe in (a) a straight condition and (b) buckling condition.
also rational because they represent the whole cell stiffness property compared to the reported local Young’s modulus of the yeast cell; that is, 0.72 ±
0.06 MPa (Pelling et al. 2004). Our method shows improved data sensitivity
compared to other global stiffness measurement methods that rely on compression of a single cell between one large indenter and a substrate. Data
from this method may not represent the actual global cell stiffness because
extra dissipation force may be included in the measurement as reported by
Smith et al. (2000) for the global cell spring constant and Young’s modulus of
yeast cell as 11.1 N/m and 112 MPa.
9.7 Summary
In this chapter nanorobotic nanomanipulation inside electron microscopes
was presented. An E-SEM nanomanipulation system was used to observe
and manipulate biological samples in nanoscale resolution. The system can
be used for various applications for the direct observation and manipulation
of biological samples with nondrying, nondyeing, noncoating treatments,
with a 7-DOF nanomanipulator with a sharp pyramidal end-effector and a
cooling stage; that is, a temperature controller. We demonstrated in situ measurements of mechanical properties of individual W303 wild-type yeast cells
using several types of nanoprobes. Compression experiments to penetrate
the cell walls of single cells of different cell sizes (about 3–6 μm diameter)
and growth phases (early log, mid log, late log, and saturation) were conducted. Data clearly show an increment in penetration force; that is, 96 ± 2,
124 ± 10, 163 ± 1, and 234 ± 14 nN for 3, 4, 5, and 6 μm cell diameters, respectively. This was further confirmed from quantitative estimation of average
cell rigidity through the Hertz model. The penetration forces at different cell
growth phases also show the increment pattern from log (early, mid, and late)
Nanorobotic Manipulation for a Single Biological Cell
Soft
nanoneedle
Cell
5 μm
5 μm
(a) Before buckling
(b) After buckling
FIGURE 9.16
Single-cell global stiffness measurement from a single point using an Si nanoprobe. Two
images show the Si nanoprobe in (a) a straight condition and (b) buckling condition.
also rational because they represent the whole cell stiffness property compared to the reported local Young’s modulus of the yeast cell; that is, 0.72 ±
0.06 MPa (Pelling et al. 2004). Our method shows improved data sensitivity
compared to other global stiffness measurement methods that rely on compression of a single cell between one large indenter and a substrate. Data
from this method may not represent the actual global cell stiffness because
extra dissipation force may be included in the measurement as reported by
Smith et al. (2000) for the global cell spring constant and Young’s modulus of
yeast cell as 11.1 N/m and 112 MPa.
9.7 Summary
In this chapter nanorobotic nanomanipulation inside electron microscopes
was presented. An E-SEM nanomanipulation system was used to observe
and manipulate biological samples in nanoscale resolution. The system can
be used for various applications for the direct observation and manipulation
of biological samples with nondrying, nondyeing, noncoating treatments,
with a 7-DOF nanomanipulator with a sharp pyramidal end-effector and a
cooling stage; that is, a temperature controller. We demonstrated in situ measurements of mechanical properties of individual W303 wild-type yeast cells
using several types of nanoprobes. Compression experiments to penetrate
the cell walls of single cells of different cell sizes (about 3–6 μm diameter)
and growth phases (early log, mid log, late log, and saturation) were conducted. Data clearly show an increment in penetration force; that is, 96 ± 2,
124 ± 10, 163 ± 1, and 234 ± 14 nN for 3, 4, 5, and 6 μm cell diameters, respectively. This was further confirmed from quantitative estimation of average
cell rigidity through the Hertz model. The penetration forces at different cell
growth phases also show the increment pattern from log (early, mid, and late)