

184
Biologically Inspired Robotics
Si nanoneedle
Buckling
nanoneedle
Referenced
cantilever
10 μm
10 μm
(a) Before
(b) After
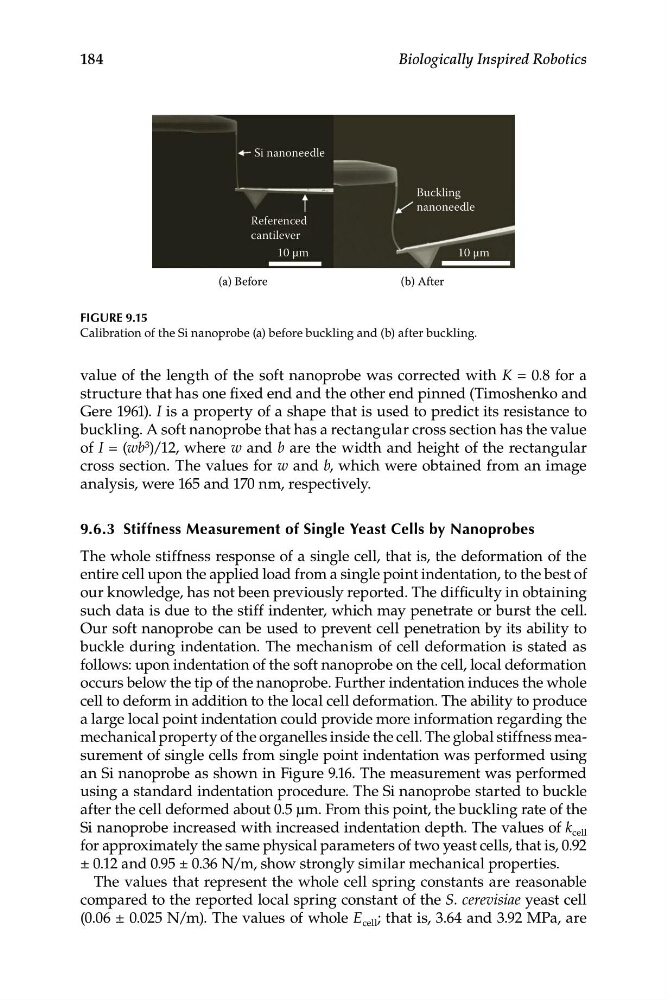
FIGURE 9.15
Calibration of the Si nanoprobe (a) before buckling and (b) after buckling.
value of the length of the soft nanoprobe was corrected with K = 0.8 for a
structure that has one fixed end and the other end pinned (Timoshenko and
Gere 1961). I is a property of a shape that is used to predict its resistance to
buckling. A soft nanoprobe that has a rectangular cross section has the value
of I = (wb 3 )/12, where w and b are the width and height of the rectangular
cross section. The values for w and b, which were obtained from an image
analysis, were 165 and 170 nm, respectively.
9.6.3 Stiffness Measurement of Single Yeast Cells by Nanoprobes
The whole stiffness response of a single cell, that is, the deformation of the
entire cell upon the applied load from a single point indentation, to the best of
our knowledge, has not been previously reported. The difficulty in obtaining
such data is due to the stiff indenter, which may penetrate or burst the cell.
Our soft nanoprobe can be used to prevent cell penetration by its ability to
buckle during indentation. The mechanism of cell deformation is stated as
follows: upon indentation of the soft nanoprobe on the cell, local deformation
occurs below the tip of the nanoprobe. Further indentation induces the whole
cell to deform in addition to the local cell deformation. The ability to produce
a large local point indentation could provide more information regarding the
mechanical property of the organelles inside the cell. The global stiffness measurement of single cells from single point indentation was performed using
an Si nanoprobe as shown in Figure 9.16. The measurement was performed
using a standard indentation procedure. The Si nanoprobe started to buckle
after the cell deformed about 0.5 μm. From this point, the buckling rate of the
Si nanoprobe increased with increased indentation depth. The values of k cell
for approximately the same physical parameters of two yeast cells, that is, 0.92
± 0.12 and 0.95 ± 0.36 N/m, show strongly similar mechanical properties.
The values that represent the whole cell spring constants are reasonable
compared to the reported local spring constant of the S. cerevisiae yeast cell
(0.06 ± 0.025 N/m). The values of whole E cell ; that is, 3.64 and 3.92 MPa, are
Biologically Inspired Robotics
Si nanoneedle
Buckling
nanoneedle
Referenced
cantilever
10 μm
10 μm
(a) Before
(b) After
FIGURE 9.15
Calibration of the Si nanoprobe (a) before buckling and (b) after buckling.
value of the length of the soft nanoprobe was corrected with K = 0.8 for a
structure that has one fixed end and the other end pinned (Timoshenko and
Gere 1961). I is a property of a shape that is used to predict its resistance to
buckling. A soft nanoprobe that has a rectangular cross section has the value
of I = (wb 3 )/12, where w and b are the width and height of the rectangular
cross section. The values for w and b, which were obtained from an image
analysis, were 165 and 170 nm, respectively.
9.6.3 Stiffness Measurement of Single Yeast Cells by Nanoprobes
The whole stiffness response of a single cell, that is, the deformation of the
entire cell upon the applied load from a single point indentation, to the best of
our knowledge, has not been previously reported. The difficulty in obtaining
such data is due to the stiff indenter, which may penetrate or burst the cell.
Our soft nanoprobe can be used to prevent cell penetration by its ability to
buckle during indentation. The mechanism of cell deformation is stated as
follows: upon indentation of the soft nanoprobe on the cell, local deformation
occurs below the tip of the nanoprobe. Further indentation induces the whole
cell to deform in addition to the local cell deformation. The ability to produce
a large local point indentation could provide more information regarding the
mechanical property of the organelles inside the cell. The global stiffness measurement of single cells from single point indentation was performed using
an Si nanoprobe as shown in Figure 9.16. The measurement was performed
using a standard indentation procedure. The Si nanoprobe started to buckle
after the cell deformed about 0.5 μm. From this point, the buckling rate of the
Si nanoprobe increased with increased indentation depth. The values of k cell
for approximately the same physical parameters of two yeast cells, that is, 0.92
± 0.12 and 0.95 ± 0.36 N/m, show strongly similar mechanical properties.
The values that represent the whole cell spring constants are reasonable
compared to the reported local spring constant of the S. cerevisiae yeast cell
(0.06 ± 0.025 N/m). The values of whole E cell ; that is, 3.64 and 3.92 MPa, are