

101
A School of Robotic Fish for Pollution Detection in Port
50
45
40
35
No of Robots Localising
30
25
0
5
10
15
20
25
30
k d
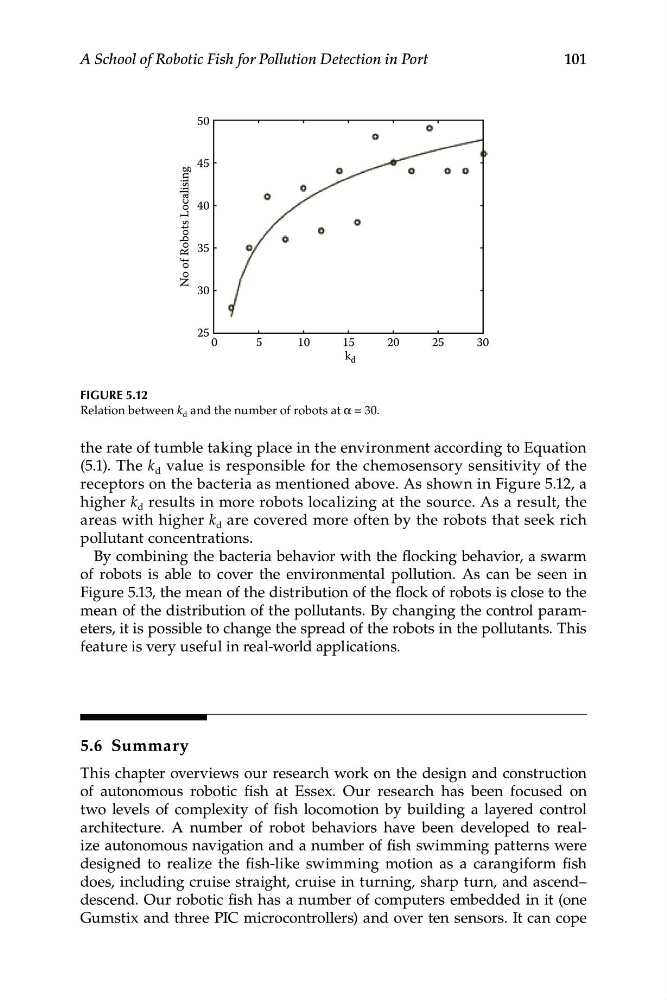
FIGURE 5.12
Relation between k d and the number of robots at α = 30.
the rate of tumble taking place in the environment according to Equation
(5.1). The k d value is responsible for the chemosensory sensitivity of the
receptors on the bacteria as mentioned above. As shown in Figure 5.12, a
higher k d results in more robots localizing at the source. As a result, the
areas with higher k d are covered more often by the robots that seek rich
pollutant concentrations.
By combining the bacteria behavior with the flocking behavior, a swarm
of robots is able to cover the environmental pollution. As can be seen in
Figure 5.13, the mean of the distribution of the flock of robots is close to the
mean of the distribution of the pollutants. By changing the control parameters, it is possible to change the spread of the robots in the pollutants. This
feature is very useful in real-world applications.
5.6 Summary
This chapter overviews our research work on the design and construction
of autonomous robotic fish at Essex. Our research has been focused on
two levels of complexity of fish locomotion by building a layered control
architecture. A number of robot behaviors have been developed to realize autonomous navigation and a number of fish swimming patterns were
designed to realize the fish-like swimming motion as a carangiform fish
does, including cruise straight, cruise in turning, sharp turn, and ascend–
descend. Our robotic fish has a number of computers embedded in it (one
Gumstix and three PIC microcontrollers) and over ten sensors. It can cope
A School of Robotic Fish for Pollution Detection in Port
50
45
40
35
No of Robots Localising
30
25
0
5
10
15
20
25
30
k d
FIGURE 5.12
Relation between k d and the number of robots at α = 30.
the rate of tumble taking place in the environment according to Equation
(5.1). The k d value is responsible for the chemosensory sensitivity of the
receptors on the bacteria as mentioned above. As shown in Figure 5.12, a
higher k d results in more robots localizing at the source. As a result, the
areas with higher k d are covered more often by the robots that seek rich
pollutant concentrations.
By combining the bacteria behavior with the flocking behavior, a swarm
of robots is able to cover the environmental pollution. As can be seen in
Figure 5.13, the mean of the distribution of the flock of robots is close to the
mean of the distribution of the pollutants. By changing the control parameters, it is possible to change the spread of the robots in the pollutants. This
feature is very useful in real-world applications.
5.6 Summary
This chapter overviews our research work on the design and construction
of autonomous robotic fish at Essex. Our research has been focused on
two levels of complexity of fish locomotion by building a layered control
architecture. A number of robot behaviors have been developed to realize autonomous navigation and a number of fish swimming patterns were
designed to realize the fish-like swimming motion as a carangiform fish
does, including cruise straight, cruise in turning, sharp turn, and ascend–
descend. Our robotic fish has a number of computers embedded in it (one
Gumstix and three PIC microcontrollers) and over ten sensors. It can cope