

4.2 Investigation of the Reactivity of PNHSMA
75
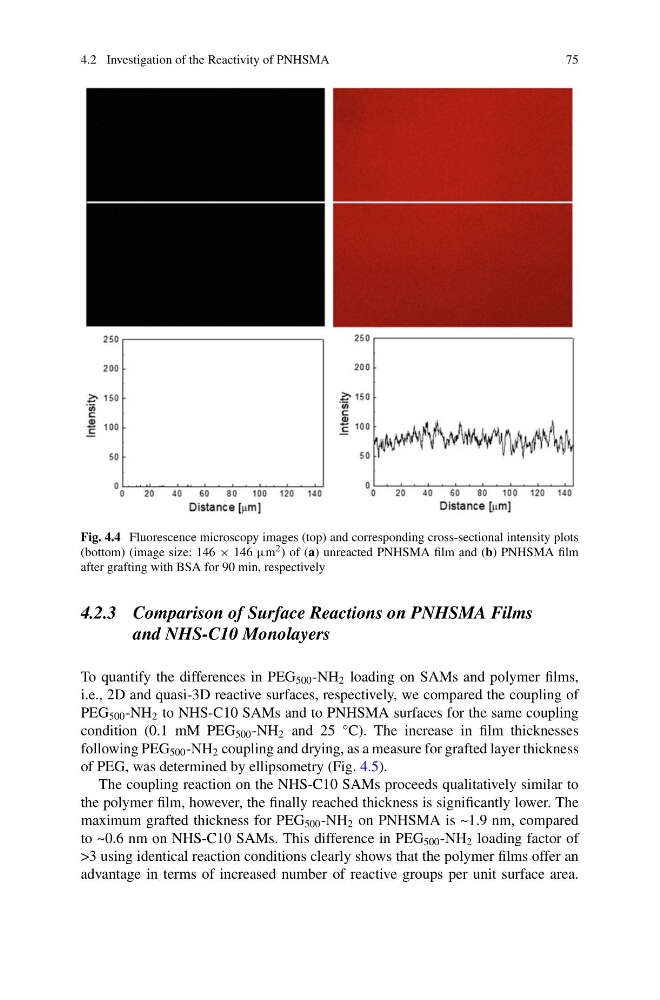
Fig. 4.4 Fluorescence microscopy images (top) and corresponding cross-sectional intensity plots
(bottom) (image size: 146 × 146 μm 2 ) of (a) unreacted PNHSMA film and (b) PNHSMA film
after grafting with BSA for 90 min, respectively
4.2.3 Comparison of Surface Reactions on PNHSMA Films
and NHS-C10 Monolayers
To quantify the differences in PEG 500 -NH 2 loading on SAMs and polymer films,
i.e., 2D and quasi-3D reactive surfaces, respectively, we compared the coupling of
PEG 500 -NH 2 to NHS-C10 SAMs and to PNHSMA surfaces for the same coupling
condition (0.1 mM PEG 500 -NH 2 and 25 °C). The increase in film thicknesses
following PEG 500 -NH 2 coupling and drying, as a measure for grafted layer thickness
of PEG, was determined by ellipsometry (Fig. 4.5).
The coupling reaction on the NHS-C10 SAMs proceeds qualitatively similar to
the polymer film, however, the finally reached thickness is significantly lower. The
maximum grafted thickness for PEG 500 -NH 2 on PNHSMA is ~1.9 nm, compared
to ~0.6 nm on NHS-C10 SAMs. This difference in PEG 500 -NH 2 loading factor of
>3 using identical reaction conditions clearly shows that the polymer films offer an
advantage in terms of increased number of reactive groups per unit surface area.
75
Fig. 4.4 Fluorescence microscopy images (top) and corresponding cross-sectional intensity plots
(bottom) (image size: 146 × 146 μm 2 ) of (a) unreacted PNHSMA film and (b) PNHSMA film
after grafting with BSA for 90 min, respectively
4.2.3 Comparison of Surface Reactions on PNHSMA Films
and NHS-C10 Monolayers
To quantify the differences in PEG 500 -NH 2 loading on SAMs and polymer films,
i.e., 2D and quasi-3D reactive surfaces, respectively, we compared the coupling of
PEG 500 -NH 2 to NHS-C10 SAMs and to PNHSMA surfaces for the same coupling
condition (0.1 mM PEG 500 -NH 2 and 25 °C). The increase in film thicknesses
following PEG 500 -NH 2 coupling and drying, as a measure for grafted layer thickness
of PEG, was determined by ellipsometry (Fig. 4.5).
The coupling reaction on the NHS-C10 SAMs proceeds qualitatively similar to
the polymer film, however, the finally reached thickness is significantly lower. The
maximum grafted thickness for PEG 500 -NH 2 on PNHSMA is ~1.9 nm, compared
to ~0.6 nm on NHS-C10 SAMs. This difference in PEG 500 -NH 2 loading factor of
>3 using identical reaction conditions clearly shows that the polymer films offer an
advantage in terms of increased number of reactive groups per unit surface area.