

4.2 Investigation of the Reactivity of PNHSMA
73
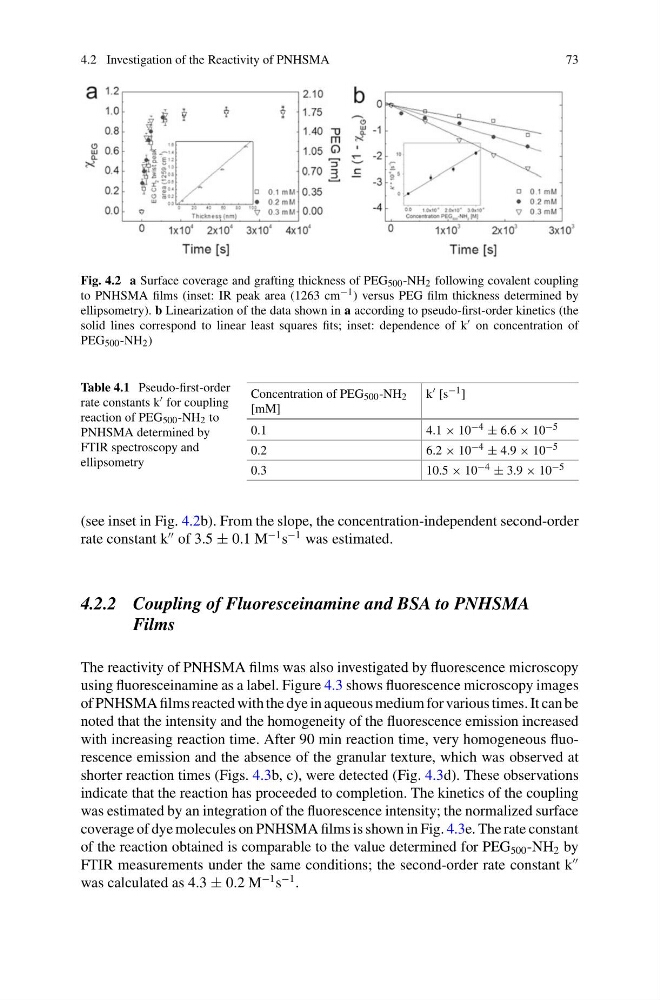
Fig. 4.2 a Surface coverage and grafting thickness of PEG 500 -NH 2 following covalent coupling
to PNHSMA films (inset: IR peak area (1263 cm −1 ) versus PEG film thickness determined by
ellipsometry). b Linearization of the data shown in a according to pseudo-first-order kinetics (the
solid lines correspond to linear least squares fits; inset: dependence of k on concentration of
PEG 500 -NH 2 )
Table 4.1 Pseudo-first-order
rate constants k for coupling
reaction of PEG 500 -NH 2 to
PNHSMA determined by
FTIR spectroscopy and
ellipsometry
Concentration of PEG 500 -NH 2
[mM]
k [s −1 ]
0.1
4.1 × 10 −4 ± 6.6 × 10 −5
0.2
6.2 × 10 −4 ± 4.9 × 10 −5
0.3
10.5 × 10 −4 ± 3.9 × 10 −5
(see inset in Fig. 4.2b). From the slope, the concentration-independent second-order
rate constant k
of 3.5 ± 0.1 M
−1 s
−1 was estimated.
4.2.2 Coupling of Fluoresceinamine and BSA to PNHSMA
Films
The reactivity of PNHSMA films was also investigated by fluorescence microscopy
using fluoresceinamine as a label. Figure 4.3 shows fluorescence microscopy images
of PNHSMA films reacted with the dye in aqueous medium for various times. It can be
noted that the intensity and the homogeneity of the fluorescence emission increased
with increasing reaction time. After 90 min reaction time, very homogeneous fluorescence emission and the absence of the granular texture, which was observed at
shorter reaction times (Figs. 4.3b, c), were detected (Fig. 4.3d). These observations
indicate that the reaction has proceeded to completion. The kinetics of the coupling
was estimated by an integration of the fluorescence intensity; the normalized surface
coverage of dye molecules on PNHSMA films is shown in Fig. 4.3e. The rate constant
of the reaction obtained is comparable to the value determined for PEG 500 -NH 2 by
FTIR measurements under the same conditions; the second-order rate constant k
was calculated as 4.3 ± 0.2 M
−1 s
−1 .
73
Fig. 4.2 a Surface coverage and grafting thickness of PEG 500 -NH 2 following covalent coupling
to PNHSMA films (inset: IR peak area (1263 cm −1 ) versus PEG film thickness determined by
ellipsometry). b Linearization of the data shown in a according to pseudo-first-order kinetics (the
solid lines correspond to linear least squares fits; inset: dependence of k on concentration of
PEG 500 -NH 2 )
Table 4.1 Pseudo-first-order
rate constants k for coupling
reaction of PEG 500 -NH 2 to
PNHSMA determined by
FTIR spectroscopy and
ellipsometry
Concentration of PEG 500 -NH 2
[mM]
k [s −1 ]
0.1
4.1 × 10 −4 ± 6.6 × 10 −5
0.2
6.2 × 10 −4 ± 4.9 × 10 −5
0.3
10.5 × 10 −4 ± 3.9 × 10 −5
(see inset in Fig. 4.2b). From the slope, the concentration-independent second-order
rate constant k
of 3.5 ± 0.1 M
−1 s
−1 was estimated.
4.2.2 Coupling of Fluoresceinamine and BSA to PNHSMA
Films
The reactivity of PNHSMA films was also investigated by fluorescence microscopy
using fluoresceinamine as a label. Figure 4.3 shows fluorescence microscopy images
of PNHSMA films reacted with the dye in aqueous medium for various times. It can be
noted that the intensity and the homogeneity of the fluorescence emission increased
with increasing reaction time. After 90 min reaction time, very homogeneous fluorescence emission and the absence of the granular texture, which was observed at
shorter reaction times (Figs. 4.3b, c), were detected (Fig. 4.3d). These observations
indicate that the reaction has proceeded to completion. The kinetics of the coupling
was estimated by an integration of the fluorescence intensity; the normalized surface
coverage of dye molecules on PNHSMA films is shown in Fig. 4.3e. The rate constant
of the reaction obtained is comparable to the value determined for PEG 500 -NH 2 by
FTIR measurements under the same conditions; the second-order rate constant k
was calculated as 4.3 ± 0.2 M
−1 s
−1 .