

58
3 Confinement Effects on the Reactivity in Ultrathin …
Table 3.6 Peak assignments
and wavenumbers for infrared
spectra of PS-b-PtBA and
PS-b-PAA films on oxidized
silicon [26]
Vibration
PS block
(cm −1 )
PtBA block
(cm −1 )
PAA block
(cm −1 )
ν(CH) aromat
3083,3062,3061
ν as (CH 3 )
2978
ν s (CH 3 )
2875
ν as (CH 2 )
2924
2926
2926
ν s (CH 2 )
2850
2852
2852
ν(C = O)
1733
1710
ν(CC) aromat
1493,1453
δ s (CH 3 )
1392,1368
ν(C–O–C)
1257,1145
ν(C–O) COOH
1245,1170
anticipated to yield an underestimate of the extent of the surface hydrolysis reaction.
Considering the depth information for the transmission FTIR measurements, it is
obvious that the IR active chromophores throughout the entire depth of the thin film
will contribute to the measured signal [24]. Therefore, the kinetics was determined
via FTIR measurement.
The vibrational assignments and peak wavenumbers of the major absorptions in
the spectra of unhydrolyzed PS n -b-PtBA m before and after hydrolysis are listed in
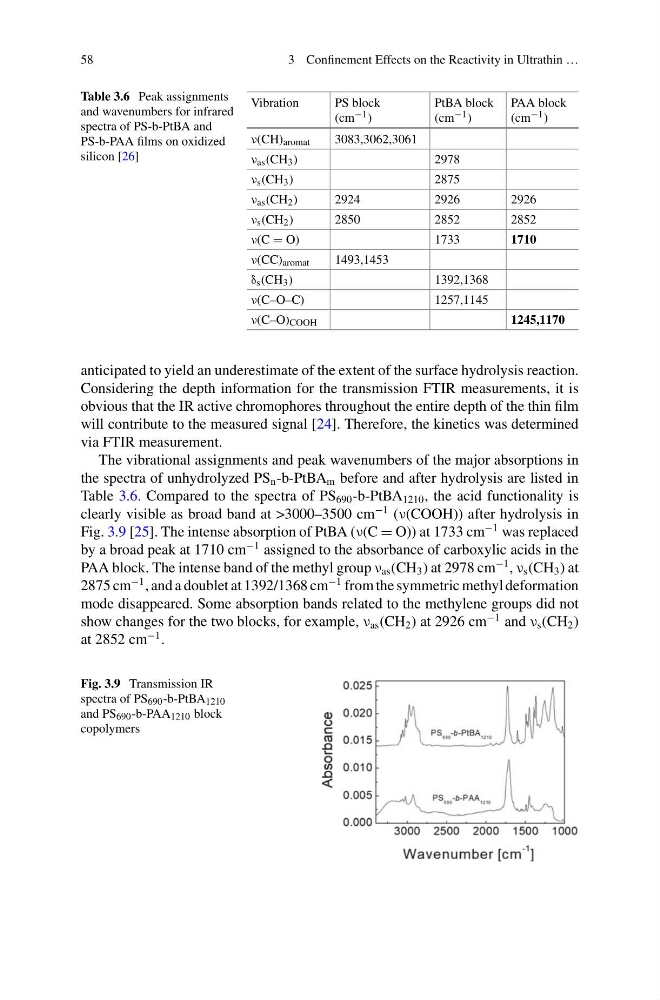
Table 3.6. Compared to the spectra of PS 690 -b-PtBA 1210 , the acid functionality is
clearly visible as broad band at >3000–3500 cm
−1 (ν(COOH)) after hydrolysis in
Fig. 3.9 [25]. The intense absorption of PtBA (ν(C = O)) at 1733 cm
−1 was replaced
by a broad peak at 1710 cm
−1 assigned to the absorbance of carboxylic acids in the
PAA block. The intense band of the methyl group ν as (CH 3 ) at 2978 cm
−1 , ν s (CH 3 ) at
2875 cm
−1 , and a doublet at 1392/1368 cm
−1 from the symmetric methyl deformation
mode disappeared. Some absorption bands related to the methylene groups did not
show changes for the two blocks, for example, ν as (CH 2 ) at 2926 cm
−1 and ν s (CH 2 )
at 2852 cm
−1 .
Fig. 3.9 Transmission IR
spectra of PS 690 -b-PtBA 1210
and PS 690 -b-PAA 1210 block
copolymers
3 Confinement Effects on the Reactivity in Ultrathin …
Table 3.6 Peak assignments
and wavenumbers for infrared
spectra of PS-b-PtBA and
PS-b-PAA films on oxidized
silicon [26]
Vibration
PS block
(cm −1 )
PtBA block
(cm −1 )
PAA block
(cm −1 )
ν(CH) aromat
3083,3062,3061
ν as (CH 3 )
2978
ν s (CH 3 )
2875
ν as (CH 2 )
2924
2926
2926
ν s (CH 2 )
2850
2852
2852
ν(C = O)
1733
1710
ν(CC) aromat
1493,1453
δ s (CH 3 )
1392,1368
ν(C–O–C)
1257,1145
ν(C–O) COOH
1245,1170
anticipated to yield an underestimate of the extent of the surface hydrolysis reaction.
Considering the depth information for the transmission FTIR measurements, it is
obvious that the IR active chromophores throughout the entire depth of the thin film
will contribute to the measured signal [24]. Therefore, the kinetics was determined
via FTIR measurement.
The vibrational assignments and peak wavenumbers of the major absorptions in
the spectra of unhydrolyzed PS n -b-PtBA m before and after hydrolysis are listed in
Table 3.6. Compared to the spectra of PS 690 -b-PtBA 1210 , the acid functionality is
clearly visible as broad band at >3000–3500 cm
−1 (ν(COOH)) after hydrolysis in
Fig. 3.9 [25]. The intense absorption of PtBA (ν(C = O)) at 1733 cm
−1 was replaced
by a broad peak at 1710 cm
−1 assigned to the absorbance of carboxylic acids in the
PAA block. The intense band of the methyl group ν as (CH 3 ) at 2978 cm
−1 , ν s (CH 3 ) at
2875 cm
−1 , and a doublet at 1392/1368 cm
−1 from the symmetric methyl deformation
mode disappeared. Some absorption bands related to the methylene groups did not
show changes for the two blocks, for example, ν as (CH 2 ) at 2926 cm
−1 and ν s (CH 2 )
at 2852 cm
−1 .
Fig. 3.9 Transmission IR
spectra of PS 690 -b-PtBA 1210
and PS 690 -b-PAA 1210 block
copolymers