

3.3 Ultrathin PS n -b-PtBA m Polymer Films
59
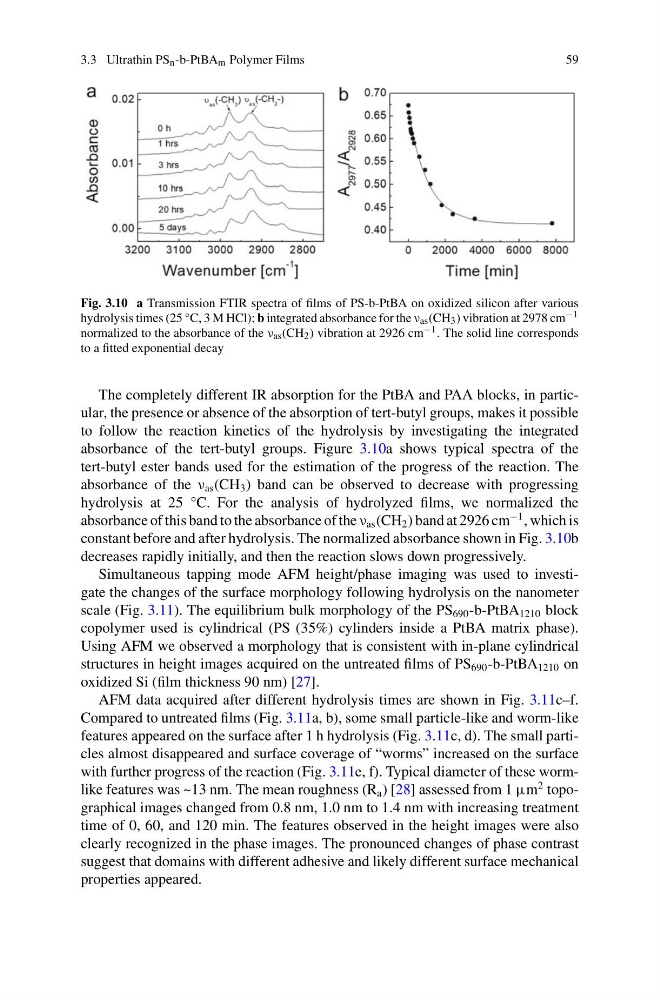
Fig. 3.10 a Transmission FTIR spectra of films of PS-b-PtBA on oxidized silicon after various
hydrolysis times (25 °C, 3 M HCl); b integrated absorbance for the ν as (CH 3 ) vibration at 2978 cm −1
normalized to the absorbance of the ν as (CH 2 ) vibration at 2926 cm −1 . The solid line corresponds
to a fitted exponential decay
The completely different IR absorption for the PtBA and PAA blocks, in particular, the presence or absence of the absorption of tert-butyl groups, makes it possible
to follow the reaction kinetics of the hydrolysis by investigating the integrated
absorbance of the tert-butyl groups. Figure 3.10a shows typical spectra of the
tert-butyl ester bands used for the estimation of the progress of the reaction. The
absorbance of the ν as (CH 3 ) band can be observed to decrease with progressing
hydrolysis at 25 °C. For the analysis of hydrolyzed films, we normalized the
absorbance of this band to the absorbance of the ν as (CH 2 ) band at 2926 cm
−1 , which is
constant before and after hydrolysis. The normalized absorbance shown in Fig. 3.10b
decreases rapidly initially, and then the reaction slows down progressively.
Simultaneous tapping mode AFM height/phase imaging was used to investigate the changes of the surface morphology following hydrolysis on the nanometer
scale (Fig. 3.11). The equilibrium bulk morphology of the PS 690 -b-PtBA 1210 block
copolymer used is cylindrical (PS (35%) cylinders inside a PtBA matrix phase).
Using AFM we observed a morphology that is consistent with in-plane cylindrical
structures in height images acquired on the untreated films of PS 690 -b-PtBA 1210 on
oxidized Si (film thickness 90 nm) [27].
AFM data acquired after different hydrolysis times are shown in Fig. 3.11c–f.
Compared to untreated films (Fig. 3.11a, b), some small particle-like and worm-like
features appeared on the surface after 1 h hydrolysis (Fig. 3.11c, d). The small particles almost disappeared and surface coverage of “worms” increased on the surface
with further progress of the reaction (Fig. 3.11e, f). Typical diameter of these wormlike features was ~13 nm. The mean roughness (R a ) [28] assessed from 1 μm
2 topographical images changed from 0.8 nm, 1.0 nm to 1.4 nm with increasing treatment
time of 0, 60, and 120 min. The features observed in the height images were also
clearly recognized in the phase images. The pronounced changes of phase contrast
suggest that domains with different adhesive and likely different surface mechanical
properties appeared.
59
Fig. 3.10 a Transmission FTIR spectra of films of PS-b-PtBA on oxidized silicon after various
hydrolysis times (25 °C, 3 M HCl); b integrated absorbance for the ν as (CH 3 ) vibration at 2978 cm −1
normalized to the absorbance of the ν as (CH 2 ) vibration at 2926 cm −1 . The solid line corresponds
to a fitted exponential decay
The completely different IR absorption for the PtBA and PAA blocks, in particular, the presence or absence of the absorption of tert-butyl groups, makes it possible
to follow the reaction kinetics of the hydrolysis by investigating the integrated
absorbance of the tert-butyl groups. Figure 3.10a shows typical spectra of the
tert-butyl ester bands used for the estimation of the progress of the reaction. The
absorbance of the ν as (CH 3 ) band can be observed to decrease with progressing
hydrolysis at 25 °C. For the analysis of hydrolyzed films, we normalized the
absorbance of this band to the absorbance of the ν as (CH 2 ) band at 2926 cm
−1 , which is
constant before and after hydrolysis. The normalized absorbance shown in Fig. 3.10b
decreases rapidly initially, and then the reaction slows down progressively.
Simultaneous tapping mode AFM height/phase imaging was used to investigate the changes of the surface morphology following hydrolysis on the nanometer
scale (Fig. 3.11). The equilibrium bulk morphology of the PS 690 -b-PtBA 1210 block
copolymer used is cylindrical (PS (35%) cylinders inside a PtBA matrix phase).
Using AFM we observed a morphology that is consistent with in-plane cylindrical
structures in height images acquired on the untreated films of PS 690 -b-PtBA 1210 on
oxidized Si (film thickness 90 nm) [27].
AFM data acquired after different hydrolysis times are shown in Fig. 3.11c–f.
Compared to untreated films (Fig. 3.11a, b), some small particle-like and worm-like
features appeared on the surface after 1 h hydrolysis (Fig. 3.11c, d). The small particles almost disappeared and surface coverage of “worms” increased on the surface
with further progress of the reaction (Fig. 3.11e, f). Typical diameter of these wormlike features was ~13 nm. The mean roughness (R a ) [28] assessed from 1 μm
2 topographical images changed from 0.8 nm, 1.0 nm to 1.4 nm with increasing treatment
time of 0, 60, and 120 min. The features observed in the height images were also
clearly recognized in the phase images. The pronounced changes of phase contrast
suggest that domains with different adhesive and likely different surface mechanical
properties appeared.