

172
9 Bioinspired Hierarchically Structured Polymer Interfaces …
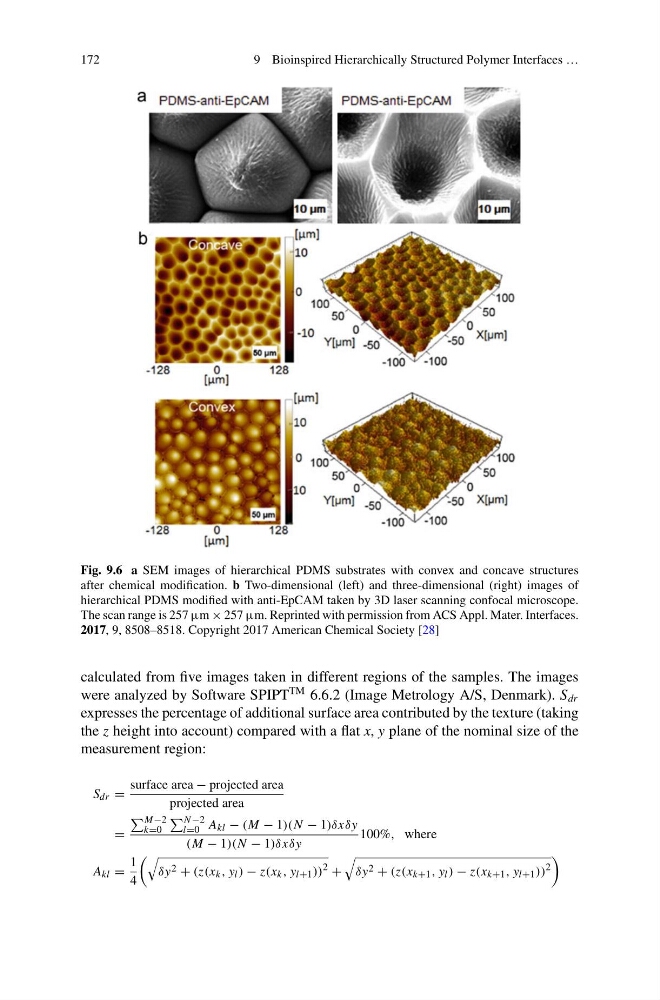
Fig. 9.6 a SEM images of hierarchical PDMS substrates with convex and concave structures
after chemical modification. b Two-dimensional (left) and three-dimensional (right) images of
hierarchical PDMS modified with anti-EpCAM taken by 3D laser scanning confocal microscope.
The scan range is 257 μm × 257 μm. Reprinted with permission from ACS Appl. Mater. Interfaces.
2017, 9, 8508–8518. Copyright 2017 American Chemical Society [28]
calculated from five images taken in different regions of the samples. The images
were analyzed by Software SPIPT
TM 6.6.2 (Image Metrology A/S, Denmark). S dr
expresses the percentage of additional surface area contributed by the texture (taking
the z height into account) compared with a flat x, y plane of the nominal size of the
measurement region:
S dr =
surface area − projected area
projected area
=
M−2
k=0
N −2
l=0 A kl − (M − 1)(N − 1)δxδy
(M − 1)(N − 1)δxδy
100%, where
A kl =
1
4
δy 2 + (z(x k , y l ) − z(x k , y l+1 ))
2 +
δy 2 + (z(x k+1 , y l ) − z(x k+1 , y l+1 ))
2
9 Bioinspired Hierarchically Structured Polymer Interfaces …
Fig. 9.6 a SEM images of hierarchical PDMS substrates with convex and concave structures
after chemical modification. b Two-dimensional (left) and three-dimensional (right) images of
hierarchical PDMS modified with anti-EpCAM taken by 3D laser scanning confocal microscope.
The scan range is 257 μm × 257 μm. Reprinted with permission from ACS Appl. Mater. Interfaces.
2017, 9, 8508–8518. Copyright 2017 American Chemical Society [28]
calculated from five images taken in different regions of the samples. The images
were analyzed by Software SPIPT
TM 6.6.2 (Image Metrology A/S, Denmark). S dr
expresses the percentage of additional surface area contributed by the texture (taking
the z height into account) compared with a flat x, y plane of the nominal size of the
measurement region:
S dr =
surface area − projected area
projected area
=
M−2
k=0
N −2
l=0 A kl − (M − 1)(N − 1)δxδy
(M − 1)(N − 1)δxδy
100%, where
A kl =
1
4
δy 2 + (z(x k , y l ) − z(x k , y l+1 ))
2 +
δy 2 + (z(x k+1 , y l ) − z(x k+1 , y l+1 ))
2