

9.2 Preparation of Rose Petal-Derived PDMS Surface Functionalized …
171
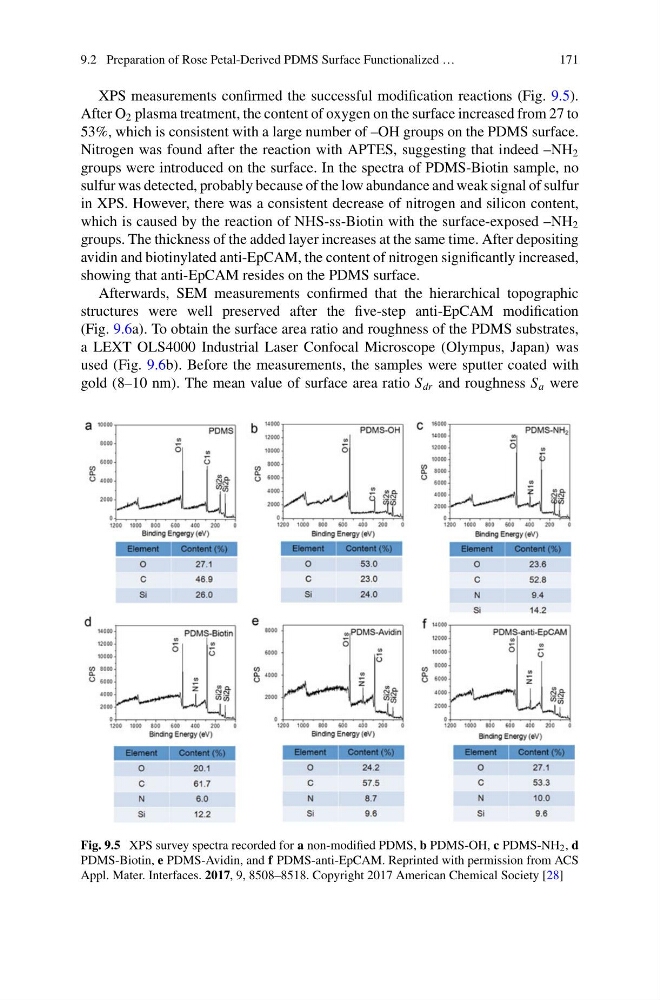
XPS measurements confirmed the successful modification reactions (Fig. 9.5).
After O 2 plasma treatment, the content of oxygen on the surface increased from 27 to
53%, which is consistent with a large number of –OH groups on the PDMS surface.
Nitrogen was found after the reaction with APTES, suggesting that indeed –NH 2
groups were introduced on the surface. In the spectra of PDMS-Biotin sample, no
sulfur was detected, probably because of the low abundance and weak signal of sulfur
in XPS. However, there was a consistent decrease of nitrogen and silicon content,
which is caused by the reaction of NHS-ss-Biotin with the surface-exposed –NH 2
groups. The thickness of the added layer increases at the same time. After depositing
avidin and biotinylated anti-EpCAM, the content of nitrogen significantly increased,
showing that anti-EpCAM resides on the PDMS surface.
Afterwards, SEM measurements confirmed that the hierarchical topographic
structures were well preserved after the five-step anti-EpCAM modification
(Fig. 9.6a). To obtain the surface area ratio and roughness of the PDMS substrates,
a LEXT OLS4000 Industrial Laser Confocal Microscope (Olympus, Japan) was
used (Fig. 9.6b). Before the measurements, the samples were sputter coated with
gold (8–10 nm). The mean value of surface area ratio S dr and roughness S a were
Fig. 9.5 XPS survey spectra recorded for a non-modified PDMS, b PDMS-OH, c PDMS-NH 2 , d
PDMS-Biotin, e PDMS-Avidin, and f PDMS-anti-EpCAM. Reprinted with permission from ACS
Appl. Mater. Interfaces. 2017, 9, 8508–8518. Copyright 2017 American Chemical Society [28]
171
XPS measurements confirmed the successful modification reactions (Fig. 9.5).
After O 2 plasma treatment, the content of oxygen on the surface increased from 27 to
53%, which is consistent with a large number of –OH groups on the PDMS surface.
Nitrogen was found after the reaction with APTES, suggesting that indeed –NH 2
groups were introduced on the surface. In the spectra of PDMS-Biotin sample, no
sulfur was detected, probably because of the low abundance and weak signal of sulfur
in XPS. However, there was a consistent decrease of nitrogen and silicon content,
which is caused by the reaction of NHS-ss-Biotin with the surface-exposed –NH 2
groups. The thickness of the added layer increases at the same time. After depositing
avidin and biotinylated anti-EpCAM, the content of nitrogen significantly increased,
showing that anti-EpCAM resides on the PDMS surface.
Afterwards, SEM measurements confirmed that the hierarchical topographic
structures were well preserved after the five-step anti-EpCAM modification
(Fig. 9.6a). To obtain the surface area ratio and roughness of the PDMS substrates,
a LEXT OLS4000 Industrial Laser Confocal Microscope (Olympus, Japan) was
used (Fig. 9.6b). Before the measurements, the samples were sputter coated with
gold (8–10 nm). The mean value of surface area ratio S dr and roughness S a were
Fig. 9.5 XPS survey spectra recorded for a non-modified PDMS, b PDMS-OH, c PDMS-NH 2 , d
PDMS-Biotin, e PDMS-Avidin, and f PDMS-anti-EpCAM. Reprinted with permission from ACS
Appl. Mater. Interfaces. 2017, 9, 8508–8518. Copyright 2017 American Chemical Society [28]