

7.4 Strategy C: Local Deprotection of PS 690 -b-PtBA 1210 Films
133
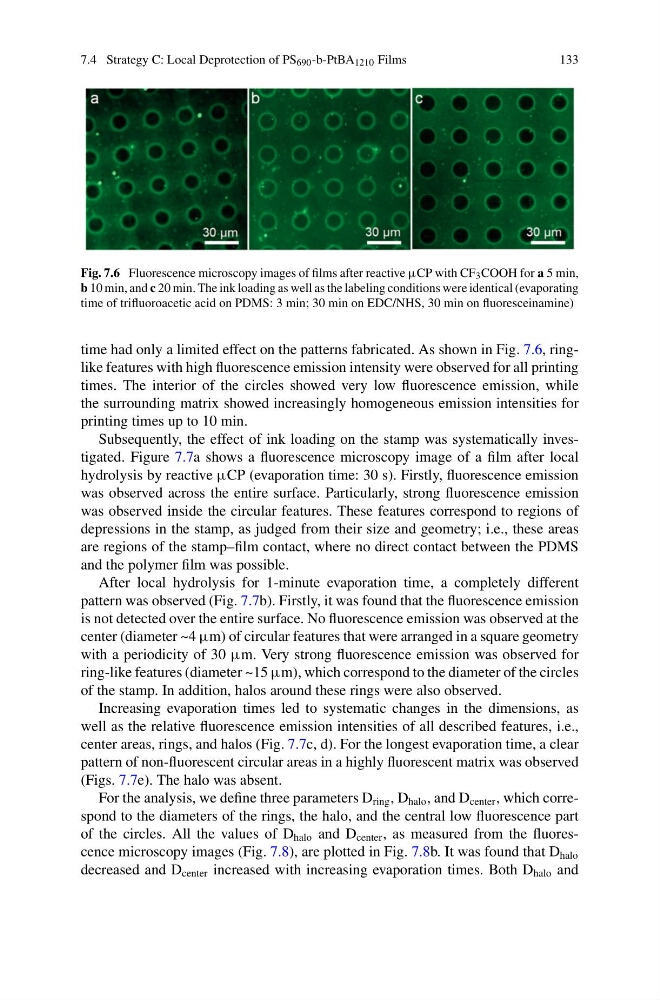
Fig. 7.6 Fluorescence microscopy images of films after reactive μCP with CF 3 COOH for a 5 min,
b 10 min, and c 20 min. The ink loading as well as the labeling conditions were identical (evaporating
time of trifluoroacetic acid on PDMS: 3 min; 30 min on EDC/NHS, 30 min on fluoresceinamine)
time had only a limited effect on the patterns fabricated. As shown in Fig. 7.6, ringlike features with high fluorescence emission intensity were observed for all printing
times. The interior of the circles showed very low fluorescence emission, while
the surrounding matrix showed increasingly homogeneous emission intensities for
printing times up to 10 min.
Subsequently, the effect of ink loading on the stamp was systematically investigated. Figure 7.7a shows a fluorescence microscopy image of a film after local
hydrolysis by reactive μCP (evaporation time: 30 s). Firstly, fluorescence emission
was observed across the entire surface. Particularly, strong fluorescence emission
was observed inside the circular features. These features correspond to regions of
depressions in the stamp, as judged from their size and geometry; i.e., these areas
are regions of the stamp–film contact, where no direct contact between the PDMS
and the polymer film was possible.
After local hydrolysis for 1-minute evaporation time, a completely different
pattern was observed (Fig. 7.7b). Firstly, it was found that the fluorescence emission
is not detected over the entire surface. No fluorescence emission was observed at the
center (diameter ~4 μm) of circular features that were arranged in a square geometry
with a periodicity of 30 μm. Very strong fluorescence emission was observed for
ring-like features (diameter ~15 μm), which correspond to the diameter of the circles
of the stamp. In addition, halos around these rings were also observed.
Increasing evaporation times led to systematic changes in the dimensions, as
well as the relative fluorescence emission intensities of all described features, i.e.,
center areas, rings, and halos (Fig. 7.7c, d). For the longest evaporation time, a clear
pattern of non-fluorescent circular areas in a highly fluorescent matrix was observed
(Figs. 7.7e). The halo was absent.
For the analysis, we define three parameters D ring , D halo , and D center , which correspond to the diameters of the rings, the halo, and the central low fluorescence part
of the circles. All the values of D halo and D center , as measured from the fluorescence microscopy images (Fig. 7.8), are plotted in Fig. 7.8b. It was found that D halo
decreased and D center increased with increasing evaporation times. Both D halo and
133
Fig. 7.6 Fluorescence microscopy images of films after reactive μCP with CF 3 COOH for a 5 min,
b 10 min, and c 20 min. The ink loading as well as the labeling conditions were identical (evaporating
time of trifluoroacetic acid on PDMS: 3 min; 30 min on EDC/NHS, 30 min on fluoresceinamine)
time had only a limited effect on the patterns fabricated. As shown in Fig. 7.6, ringlike features with high fluorescence emission intensity were observed for all printing
times. The interior of the circles showed very low fluorescence emission, while
the surrounding matrix showed increasingly homogeneous emission intensities for
printing times up to 10 min.
Subsequently, the effect of ink loading on the stamp was systematically investigated. Figure 7.7a shows a fluorescence microscopy image of a film after local
hydrolysis by reactive μCP (evaporation time: 30 s). Firstly, fluorescence emission
was observed across the entire surface. Particularly, strong fluorescence emission
was observed inside the circular features. These features correspond to regions of
depressions in the stamp, as judged from their size and geometry; i.e., these areas
are regions of the stamp–film contact, where no direct contact between the PDMS
and the polymer film was possible.
After local hydrolysis for 1-minute evaporation time, a completely different
pattern was observed (Fig. 7.7b). Firstly, it was found that the fluorescence emission
is not detected over the entire surface. No fluorescence emission was observed at the
center (diameter ~4 μm) of circular features that were arranged in a square geometry
with a periodicity of 30 μm. Very strong fluorescence emission was observed for
ring-like features (diameter ~15 μm), which correspond to the diameter of the circles
of the stamp. In addition, halos around these rings were also observed.
Increasing evaporation times led to systematic changes in the dimensions, as
well as the relative fluorescence emission intensities of all described features, i.e.,
center areas, rings, and halos (Fig. 7.7c, d). For the longest evaporation time, a clear
pattern of non-fluorescent circular areas in a highly fluorescent matrix was observed
(Figs. 7.7e). The halo was absent.
For the analysis, we define three parameters D ring , D halo , and D center , which correspond to the diameters of the rings, the halo, and the central low fluorescence part
of the circles. All the values of D halo and D center , as measured from the fluorescence microscopy images (Fig. 7.8), are plotted in Fig. 7.8b. It was found that D halo
decreased and D center increased with increasing evaporation times. Both D halo and