

134
7 Reactive μCP on Ultrathin Block Copolymer Films …
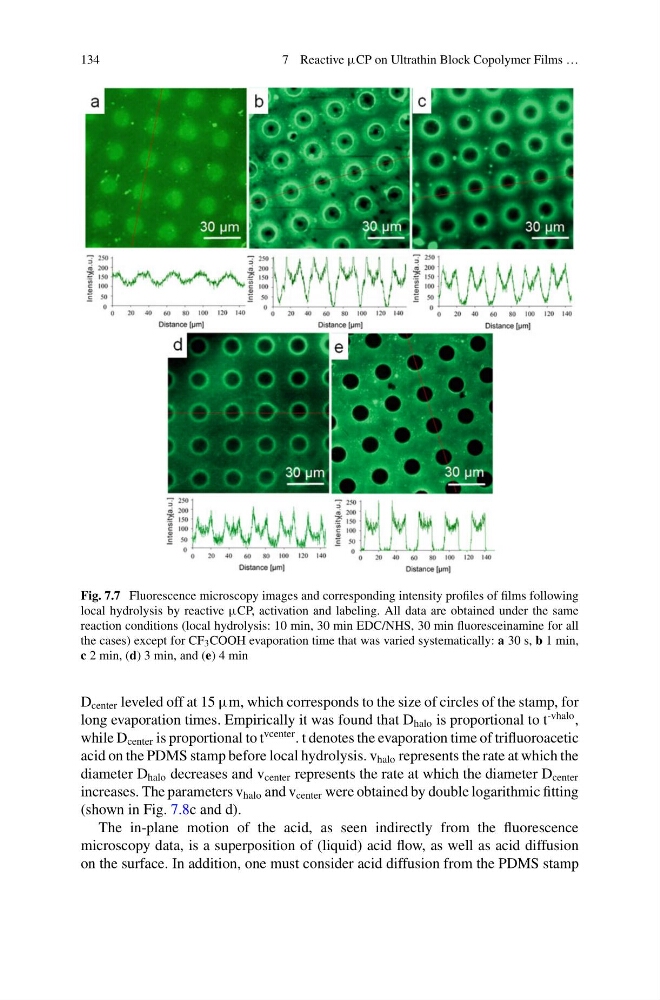
Fig. 7.7 Fluorescence microscopy images and corresponding intensity profiles of films following
local hydrolysis by reactive μCP, activation and labeling. All data are obtained under the same
reaction conditions (local hydrolysis: 10 min, 30 min EDC/NHS, 30 min fluoresceinamine for all
the cases) except for CF 3 COOH evaporation time that was varied systematically: a 30 s, b 1 min,
c 2 min, (d) 3 min, and (e) 4 min
D center leveled off at 15 μm, which corresponds to the size of circles of the stamp, for
long evaporation times. Empirically it was found that D halo is proportional to t
-vhalo ,
while D center is proportional to t
vcenter . t denotes the evaporation time of trifluoroacetic
acid on the PDMS stamp before local hydrolysis. v halo represents the rate at which the
diameter D halo decreases and v center represents the rate at which the diameter D center
increases. The parameters v halo and v center were obtained by double logarithmic fitting
(shown in Fig. 7.8c and d).
The in-plane motion of the acid, as seen indirectly from the fluorescence
microscopy data, is a superposition of (liquid) acid flow, as well as acid diffusion
on the surface. In addition, one must consider acid diffusion from the PDMS stamp
7 Reactive μCP on Ultrathin Block Copolymer Films …
Fig. 7.7 Fluorescence microscopy images and corresponding intensity profiles of films following
local hydrolysis by reactive μCP, activation and labeling. All data are obtained under the same
reaction conditions (local hydrolysis: 10 min, 30 min EDC/NHS, 30 min fluoresceinamine for all
the cases) except for CF 3 COOH evaporation time that was varied systematically: a 30 s, b 1 min,
c 2 min, (d) 3 min, and (e) 4 min
D center leveled off at 15 μm, which corresponds to the size of circles of the stamp, for
long evaporation times. Empirically it was found that D halo is proportional to t
-vhalo ,
while D center is proportional to t
vcenter . t denotes the evaporation time of trifluoroacetic
acid on the PDMS stamp before local hydrolysis. v halo represents the rate at which the
diameter D halo decreases and v center represents the rate at which the diameter D center
increases. The parameters v halo and v center were obtained by double logarithmic fitting
(shown in Fig. 7.8c and d).
The in-plane motion of the acid, as seen indirectly from the fluorescence
microscopy data, is a superposition of (liquid) acid flow, as well as acid diffusion
on the surface. In addition, one must consider acid diffusion from the PDMS stamp