

174
A. Puranik et al.
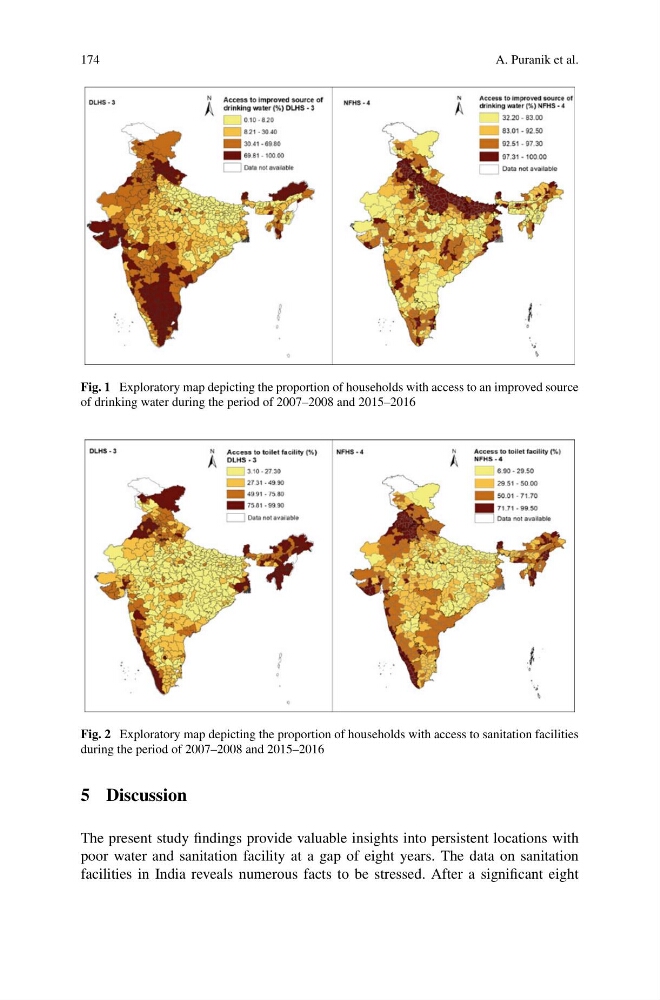
Fig. 1 Exploratory map depicting the proportion of households with access to an improved source
of drinking water during the period of 2007–2008 and 2015–2016
Fig. 2 Exploratory map depicting the proportion of households with access to sanitation facilities
during the period of 2007–2008 and 2015–2016
5 Discussion
The present study findings provide valuable insights into persistent locations with
poor water and sanitation facility at a gap of eight years. The data on sanitation
facilities in India reveals numerous facts to be stressed. After a significant eight
A. Puranik et al.
Fig. 1 Exploratory map depicting the proportion of households with access to an improved source
of drinking water during the period of 2007–2008 and 2015–2016
Fig. 2 Exploratory map depicting the proportion of households with access to sanitation facilities
during the period of 2007–2008 and 2015–2016
5 Discussion
The present study findings provide valuable insights into persistent locations with
poor water and sanitation facility at a gap of eight years. The data on sanitation
facilities in India reveals numerous facts to be stressed. After a significant eight